Contents
What is Natural Language Search?
What Can You Use the Search Anything Model for?
How to Use Search Anything Model with Encord?
Conclusion
Encord Blog
Search Anything Model: Combining Vision and Natural Language in Search


Written by


Frederik Hvilshøj
View more postsIn the current AI boom, one thing is certain: data is king.
Data is at the heart of the production and development of new models; and yet, the processing and structuring required to get data to a form that is consumable by modern AI are often overlooked.
One of the most primordial elements of intelligence that can be leveraged to facilitate this is search. Search is crucial to understanding data: the more ways to search and group data, the more insights you can extract. The greater the insights, the more structured the data becomes.
Historically, search capabilities have been limited to uni-modal approaches: models used for images or videos in vision use cases have been distinct from those used for textual data in natural language processing. With GPT-4’s ability to process both images and text, we are only now starting to see the potential impacts of performant multi-modal models that span various forms of data.
Embracing the future of multi-modal data, we propose the Search Anything Model. The unified framework combines natural language, visual property, similarity, and metadata search together in a single package. Leveraging computer vision processing, multi-modal embeddings, LLMs, and traditional search characteristics, Search Anything allows for multiple forms of structured data querying using natural language.
If you want to find all bright images with multiple cats that look similar to a particular reference image, Search Anything will match over multiple index types to retrieve data of the requisite form and conditions.
What is Natural Language Search?
Natural Language Search (NLS) uses human-like language to query and retrieve information from databases, datasets, or documents. Unlike traditional keyword-based searches, NLS algorithms employ Natural Language Processing (NLP) techniques to understand the context, semantics, and intent behind user queries.
By interpreting the query’s meaning, NLS systems provide more accurate and relevant search results, mimicking how humans communicate. The computer vision domain requires a similar general understanding of data content without requiring metadata for visuals.
What Can You Use the Search Anything Model for?
Let’s dive into some examples of computer vision uses for the Search Anything Model.
Data Exploration
Search Anything simplifies data exploration by allowing users to ask questions in plain language and receive valuable insights.
Instead of manually formulating complex queries and algorithms that may require pre-existing metadata, you can pose questions such as:
“Which images are blurry?”
Or
“How is my model performing on images with multiple labels?”
Search Anything interprets these queries to provide visualizations or summaries of the data quickly and effectively to gain valuable insights.


Data Curation
Search Anything streamlines data curation, making the process highly efficient and user-friendly. Filter, sort, or aggregate data using only natural language commands
For example, you can request the following:
“Remove all the very bright images from my dataset”
Or
“Add an ‘unannotated’ tag to all the data that has not been annotated yet.”
Search Anything processes these commands, automatically performs the requested actions, and presents the curated data all without complex coding or SQL queries.
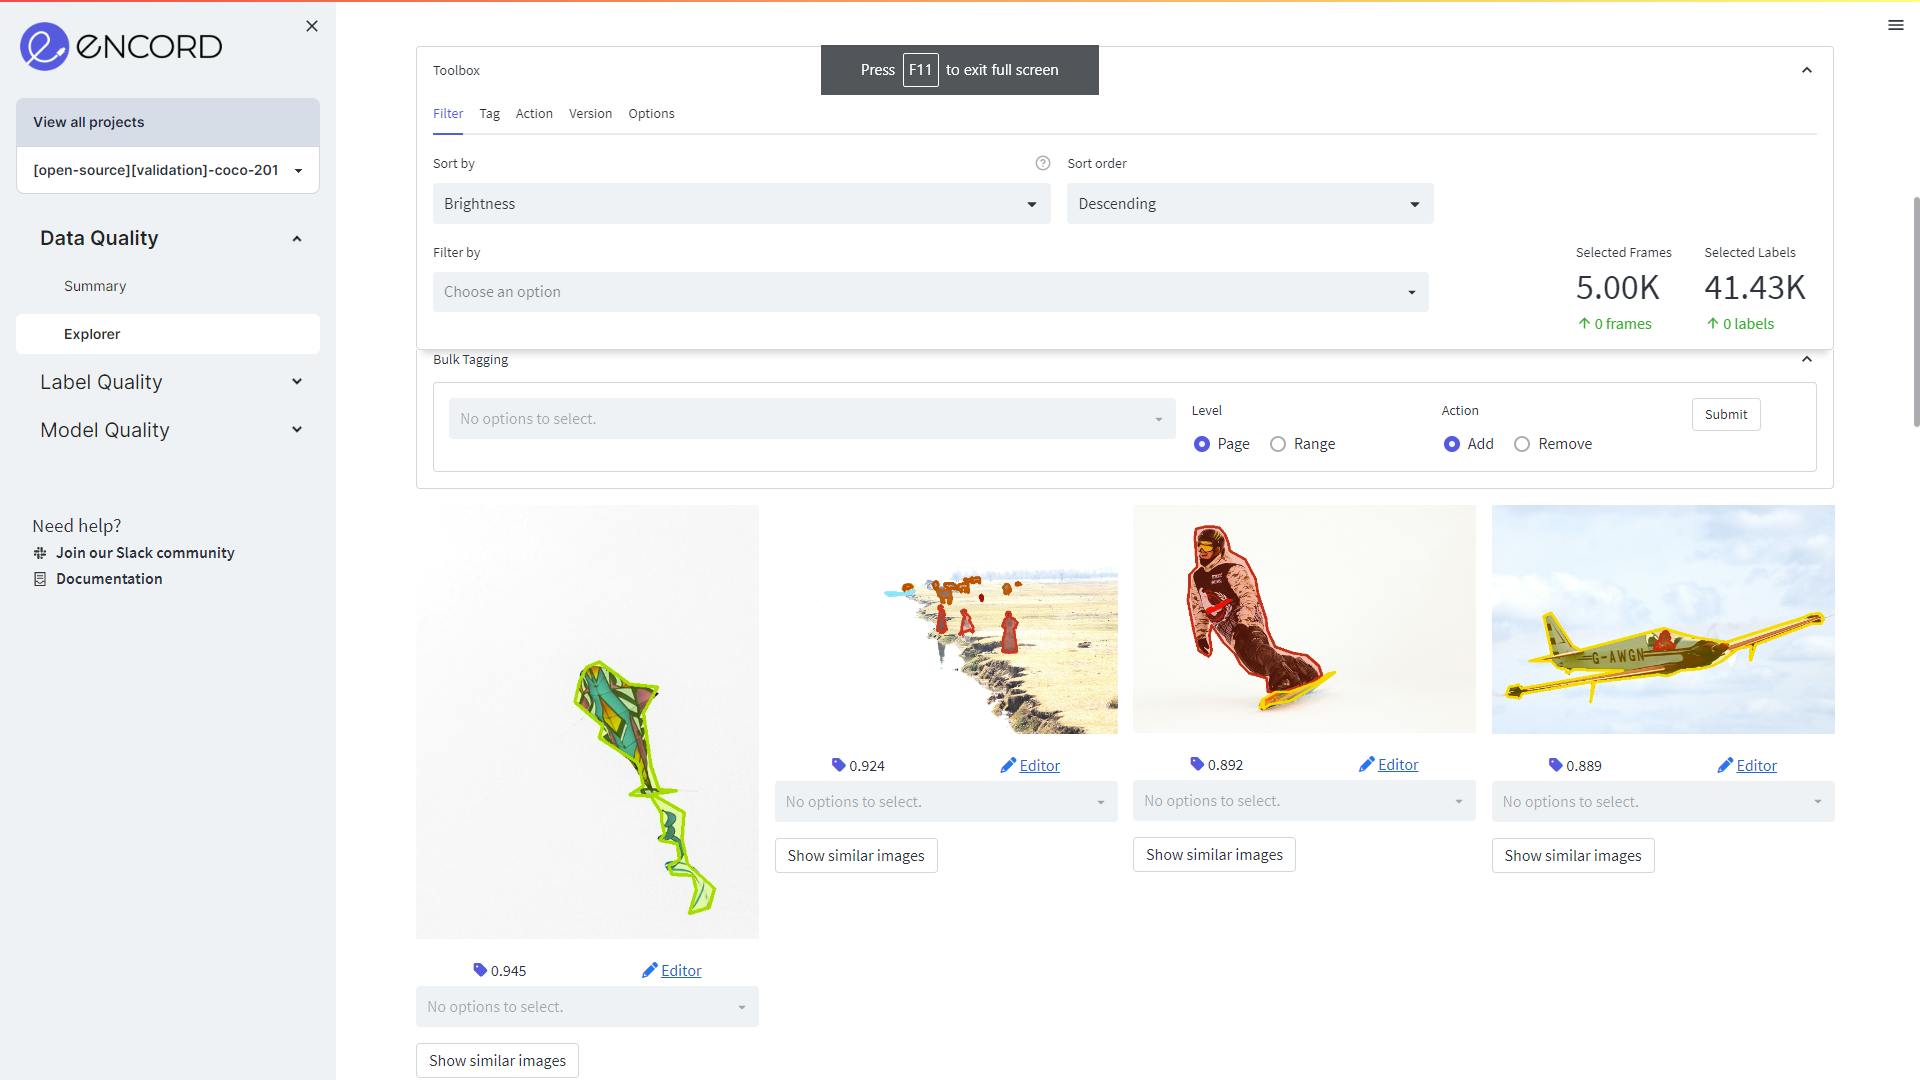
Using Encord Active to filter out bright images in the COCO dataset. Use the bulk tagging feature to tag all the data.
Data Debugging
Search Anything expedites the process of identifying and resolving data issues.
To investigate anomalies to inconsistencies, ask questions or issue commands such as:
“Are there any missing values for the image difficulty quality metric?”
Or
“Find records that are labeled ‘cat’ but don’t look like a typical cat.”
Once again, Search Anything analyzes the data, detects discrepancies, and provides actionable insights to assist you in identifying and rectifying data problems efficiently.
Cataloging Data for E-commerce
Search Anything can also enhance the cataloging process for e-commerce platforms. By understanding product photos and descriptions, Search Anything enable users to search and categorize products efficiently, users can ask: .
“Locate the green and sparkly shoes.”
Search Anything interprets this query, matches the desired criteria with the product images and descriptions, and displays the relevant products, facilitating improved product discovery and customer experience.
How to Use Search Anything Model with Encord?
At Encord, we are building an end-to-end visual data engine for computer vision. Our latest release, Encord Active, empowers users to interact with visual data only using natural language.
Let’s dive into a few use cases:
Use Case 1: Data Exploration
User Query: “red dress,” “denim jeans,” and “black shirts”
Encord Active identifies the images in the dataset that most accurately corresponds to the query.
Use Case 2: Data Curation
User query: “Display the very bright images”
Encord Active displays filtered results from the dataset based on the specified criterion.
Use Case 3: Data Debugging
User Query: “Find all the non-singular images?”
Encord Active detects any duplicated images in the dataset, and displays images that are not unique within the dataset.
Can I Use My Own Model?
Yes, Encord Active allows you to leverage your models. Through fine-tuning or integrating custom embedding models, you can tailor the search capabilities to your specific needs, ensuring optimal performance and relevance.


Conclusion
Natural Language Search is revolutionizing the way we interact with data, enabling intuitive and efficient exploration, curation, and debugging.
By harnessing the power of NLP and computer vision models, our Search Anything Model allows you to pose queries, issue commands, and obtain actionable insights using human-like language. Whether you are an ML engineer, a data scientist, or an e-commerce professional, incorporating NLS into your workflow can significantly enhance productivity and unlock the full potential of your data.
Build better ML models with Encord
Get started todayWritten by
Frederik Hvilshøj
View more postsRelated blogs


How To Use Encord’s Bitmask Brush Tool
In machine learning, precise image annotation is crucial for training accurate and reliable models. Encord's Bitmask brush tool revolutionizes the annotation process by allowing interactive and fine-grained selection of regions of interest within images. Designed to cater to the needs of machine learning practitioners, this comprehensive guide will walk you through the ins and outs of utilizing Encord's Bitmask brush tool, empowering you to create precise and highly accurate annotations within the Encord platform. What is the bit mask brush? A bit mask brush allows you to interactively define regions or areas of interest within an image by "brushing" over them. As you paint or brush over the image, the bit mask brush assigns specific ‘bits’ or values to the corresponding pixels or regions you select. These bits represent the labels or categories associated with the selected areas. Accessing brush tool: Click on 🖌️ or press ‘f’ For example, if you are labeling outlines of blood vessels in an image, you can use a bit of mask brush to brush over the pixels corresponding to the vessel’s boundaries. The bit mask brush would assign a specific value or bit pattern to those pixels, indicating that they belong to the vessel class or category. Similarly, if you are labeling topologically separate regions belonging to the same frame classification, you can use a bitmask brush to assign different bit patterns or values to the regions you select. This allows you to differentiate between regions or segments within the same frame category. Using the Bitmask Brush The Bitmask brush is a powerful tool for creating annotations or labels by selecting specific regions within an image, providing flexibility and control over the labeling process. Let’s explore its key functionalities: Selection and Size Adjustment When the Bitmask annotation type is selected, the brush tool is automatically chosen by default. You can access it by clicking the brush icon or pressing the 'f' key, and you are able to adjust the brush size using a convenient slider. This enables you to tailor the brush size to the level of detail needed for your annotations. Annotation Creation Once you have adjusted the brush size, you can begin annotating your image by selecting the desired areas. As you brush over the regions, the Bitmask brush assigns specific bit patterns or values to the corresponding pixels, indicating their association with the selected labels or categories. Apply Label Once your annotation is complete, you can apply the label by clicking the "Apply label" button or pressing the Enter key, finalizing the annotation and incorporating it into the labeling or annotation process. 💡To use the bitmap masks, the ontology should contain the Bitmask annotation type. Eraser The Eraser tool provides the ability to erase parts or the entirety of your bitmask selection. This can be useful if you need to refine or modify your annotations before applying the final label. You can access the Eraser tool by clicking the eraser icon or pressing the 'h' key on your keyboard while the popup window is open. Accessing eraser tool: Click on eraser icon or press ‘h’ Threshold Brush The Threshold brush, specific to DICOM images, offers additional functionality by enabling you to set an intensity value threshold for your labels. The preview toggle allows you to visualize which parts of the image correspond to your set threshold, helping you determine the areas that will be labeled when covered by the Threshold brush. To access the Threshold brush, click the corresponding icon or press the 'g' key while the popup window is open. Adjust the brush size and the range of intensity values using the sliders in the popup. Accessing threshold tool: Click on the corresponding icon or press ‘g’ With the Encord Bitmask SDK The Encord Bitmask SDK empowers you to effortlessly generate, modify, and analyze annotations within the Encord platform, leveraging the vast capabilities of Python's comprehensive libraries and tools to their fullest extent. Find more details in the bitmask documentation. To conclude, Encord’s Bitmask brush tool, equipped with its diverse range of features, offers an intuitive and flexible solution for creating annotations within the Encord platform. Harnessing the power of the Bitmask brush and the Encord Bitmask SDK, you can elevate your annotation workflow to achieve precise and reliable results. Recommended Articles Medical Image Segmentation: A Complete Guide 6 Best Open Source Annotation Tools for Medical Imaging Guide to Experiments for Medical Imaging in Machine Learning 7 Ways to Improve Medical Imaging Dataset Future for Computer Vision in Healthcare
Jun 23 2023
5 M


How to Automate Data Labeling [Examples + Tutorial]
If you feed an AI model with junk, it’s bound to return the favor. The quality of the data being consumed by an AI algorithm has a direct correlation with its success when it comes to generalizing to new instances; this is the reason data professionals spend 80% of their time during model development, ensuring the data is appropriately prepared, and is representative of the real world. Data labeling is an essential task in supervised learning, as it enables AI algorithms to create accurate input-to-output mappings and build a comprehensive understanding of their environment. Data labeling can consume up to 80% of data preparation time, and at least 25% of an entire ML project is spent labeling. Therefore, efficient data labeling strategies are critical for improving the speed and quality of machine learning model development. 💡Read the blog to learn how to automate your data labeling process. Manual data labeling can be a challenging and error-prone process, as it relies on human judgment and subjective interpretation. Labelers may have different levels of expertise, leading to consistency in the labeling process and reduced accuracy. Moreover, manual data labeling can be time-consuming and expensive, especially for large datasets. This can hinder the scalability and efficiency of AI model development. Integrating automated data labeling into your machine learning projects can be an effective strategy for mitigating the challenges of manual data labeling. By leveraging AI technology to perform data labeling tasks, businesses can reduce the risk of human error, increase the speed and efficiency of model development, and minimize costs associated with manual labeling. Additionally, automated data labeling can help improve the accuracy and consistency of labeled data, resulting in more reliable and robust AI models. Let's take a closer look at automated data labeling, including its workings, advantages, and how Encord can assist you in automating your data labeling process. Using Annotation Tools for Automated Data Labeling Automated data labeling is using software tools and algorithms to automatically annotate or tag data with labels or tags that help identify and classify the data. This process is used in machine learning and data science to create training datasets for machine learning models. “Automated data annotation is a way to harness the power of AI-assisted tools and software to accelerate and improve the quality of creating and applying labels to images and videos for computer vision models.” – Frederik H. The Full Guide to Automated Data Annotation. Annotation tools can be used for automated data labeling by providing a user interface for creating and managing annotations or labels for a dataset. These tools can help to automate the process of labeling data by providing features such as: Auto-labeling: Annotation tools can use pre-built machine learning models or algorithms to generate labels for data automatically. Active learning: Annotation tools can use machine learning algorithms to suggest labels for data based on patterns and correlations in the existing labeled data. Human-in-the-loop: Annotation tools can provide a user interface for human annotators to review and correct the labels generated by the automation process. Quality control: Annotation tools can help to ensure the quality of the labels generated by the automation process by providing tools for validation and verification. Data management: Annotation tools can provide tools for managing and organizing large datasets, including tools for filtering, searching, and exporting data. Organizations can reduce the time and cost required to create high-quality training datasets for machine learning models by using annotation tools for automated data labeling. However, it is important to ensure that the tools used are appropriate for the specific task and that the labeled data is carefully validated and verified to ensure its quality. AI Annotation Tools 💡Check out our curated list of the 9 Best Image Annotation Tools for Computer Vision to discover what other options are on the market. Encord Annotate Encord Annotate is an automated annotation platform that performs AI-assisted image annotation, video annotation, and dataset management; part of the Encord product, alongside Encord Active. The key features of Encord Annotate include: Support for all annotation types such as bounding boxes, polygons, polylines, image segmentation, and more. It incorporates auto-annotation tools such as Meta’s Segment Anything Model and other AI-assisted labeling techniques. It has integrated MLOps workflow for computer vision and machine learning teams Use-case-centric annotations — from native DICOM & NIfTI annotations for medical imaging to SAR-specific features for geospatial data. Easy collaboration, annotator management, and QA workflows — to track annotator performance and increase label quality. Robust security functionality — label audit trails, encryption, FDA, CE Compliance, and HIPAA compliance. Benefits of Automated Data Labeling with AI Annotation Tools The most straightforward way to label data is to implement it manually, where a human user is presented with raw unlabeled data and applies a set of rules to label it. However, this approach has certain drawbacks such as being time-consuming and costly and having a higher probability of natural human error. An alternative approach is to use AI annotation tools to automate the labeling process, which can help address the issues associated with manual labeling by: Increasing accuracy and efficiency: Speed is just as important as being accurate. Yes, an automatic AI annotation tool can process large amounts of images much faster than a human can, but what makes it so effective is its ability to remain accurate, which ensures labels are precise and reliable. Improving productivity and workflow: It’s normal for humans to make mistakes – especially when they are performing the same task for 8 or more hours straight. When you use an AI-assisted labeling tool, the workload is significantly reduced, which means annotating teams can put more focus on ensuring things are labeled correctly the first time around. Reduction in labeling costs and resources: Deciding to manually annotate data means paying someone or a group of people to carry out the task; this means each hour that goes by has a cost, which can quickly become extremely high. An AI-assisted labeling tool may take off some of that load by allowing a human annotation team can manually label a percentage of the data and then have an AI tool do the rest. How to Automate Data Labeling with Encord A step-by-step guide to automating data labeling with Encord: Micro models Micro-models are models that are designed to be overtrained for a specific task or piece of data, making them effective in automating one aspect of data annotation workflow. They are not meant to be good at solving general problems and are typically used for a specific purpose. 💡Read the blog to find out more about micro-models. The main difference between a traditional model and a micro-model is not in their architecture or parameters but in their application domain, the data science practices used to create them, and their ultimate end-use. Step 1: Step 2: Auto-segmentation Auto-segmentation is a technique that involves using algorithms or annotation tools to automatically segment an image or video into different regions or objects of interest. This technique is used in various industries, including medical imaging, object detection, and scene segmentation. For example, in medical imaging, auto-segmentation can be used to identify and segment different anatomical structures in images, such as tumors, organs, and blood vessels. This can help medical professionals to make more accurate diagnoses and treatment plans Auto-segmentation can potentially speed up the image analysis process and reduce the likelihood of human error. However, it is important to note that the accuracy of auto-segmentation algorithms depends on the input data quality and the segmentation task's complexity. In some cases, manual review and correction may still be necessary to ensure the accuracy of the results. 💡Read the explainer blog on Segment Anything Model to understand how foundation models are used for auto-segmentation. Interpolation Interpolation is typically used to fill in missing values or smooth the noise in a dataset. It encompasses the process of estimating the value of a function at points that lie between known data points. Several methods can be used for interpolation in ML such as linear interpolation, polynomial interpolation, and spline interpolation. The choice of interpolation method will depend on the data's characteristics and the project's goals. Step 1: Step 2: Object Tracking Object tracking plays a vital role in various applications like security and surveillance, autonomous vehicles, video analysis, and many more. It’s a crucial component of computer vision that enables machines to track and follow objects in motion Using object tracking, you will be able to predict the position and other relevant information of moving objects in a video or image sequence. Step 1: Step 2: 💡Check out the Complete Guide to Object Tracking Tutorial to for more insight.. Conclusion Supervised machine learning algorithms depend on labeled data to learn how to generalize to unseen instances. The quality of data provided to the model has a significant impact on its final performance, hence it’s vital the data is accurately labeled and representative of the data available in a real-world scenario; this means AI teams often spend a large portion of their time preparing and labeling their data before it reaches the model training phase. Manually labeling data is slow, tedious, expensive, and prone to human error. One way to mitigate this issue is with automated data labeling and annotation solutions. Such tools can serve as a cost-effective way to accurately speed up the process, which in turn improves the team’s productivity and workflow. Ready to accelerate the automation of your data annotation and labeling? Sign-up for an Encord Free Trial: The Active Learning Platform for Computer Vision, used by the world’s leading computer vision teams. AI-assisted labeling, model training & diagnostics, find & fix dataset errors and biases, all in one collaborative active learning platform, to get to production AI faster. Try Encord for Free Today. Want to stay updated? Follow us on Twitter and LinkedIn for more content on computer vision, training data, and active learning. Join our Discord channel to chat and connect. Automated Data Labeling FAQs What are the benefits of automated data labeling? Automated data labeling helps to increase the accuracy and efficiency of the labeling process in contrast to when it’s performed by humans. It also reduces labeling costs and resources as you are not required to pay labelers to perform the tasks. How is automated data labeling different than manual labeling? Manual data labeling is the process of using individual annotators to assign labels to raw data. Opposingly, automated labeling is the same thing but the responsibility is passed on to machines instead of humans to speed up the process and reduce costs. What is AI data labeling? AI data labeling refers to a technique that leverages machine learning to provide one or more meaningful labels to raw data (e.g., images, videos, etc.). This is done with the intent of offering a machine learning model with context to learn input-output mappings from the data and make inferences on new, unseen data.
May 19 2023
4 M


Object Classification with Caltech 101
Object classification is a computer vision technique that identifies and categorizes objects within an image or video. In this article, we give you all the information you need to apply object detection to the Caltech 101 Dataset. Object classification involves using machine learning algorithms, such as deep neural networks, to analyze the visual features of an image and then make predictions about the class or type of objects present in the image. What is Object classification? Object classification is often used in applications such as self-driving cars, where the vehicle must be able to recognize and classify different types of objects on the road, such as pedestrians, traffic signs, and other vehicles. Object classification for self-driving cars Source It’s also used in image recognition tasks, such as identifying specific objects within an image or detecting anomalies or defects in manufacturing processes. Object classification algorithms typically involve several steps, including feature extraction and classification. In the feature extraction step, the algorithm identifies visual features such as edges, shapes, and patterns that are characteristic of the objects in the image. These features are then used to classify the objects into predefined classes or categories, such as "car", "dog", "person", etc. The classification step involves using machine learning algorithms, such as deep neural networks, to analyze the visual features of an image and predict the class or type of object present in the image. The model is trained on a large dataset of labeled images, where the algorithm weights are adjusted iteratively to minimize the error between the predicted and actual labels. Once trained, a computer vision (CV) or machine learning (ML) model can be used to classify objects in new images by analyzing their visual features and predicting the class of the object. Object classification is a challenging task due to the variability in object appearance caused by factors such as lighting, occlusion, and pose. However, advances in machine learning and computer vision techniques have significantly improved object classification accuracy in recent years, making it an increasingly important technology in many fields. Importance of Object Classification in Computer Vision Object classification is a fundamental component of many computer vision applications such as autonomous vehicles, facial recognition, surveillance systems, and medical imaging. Here are some reasons why object classification is important in computer vision: Object classification enables algorithmic models to interpret and understand the visual world around them. By identifying objects within an image or video, ML models can extract meaningful information, such as object location, size, and orientation, and use this information to make informed decisions. Object classification is critical for tasks such as object tracking, object detection, and object recognition. These tasks are essential in applications such as autonomous vehicles, where machines must be able to detect and track objects such as pedestrians, other vehicles, and obstacles in real-time. Object classification is a key component of image and video search. By classifying objects within images and videos, machines can accurately categorize and index visual data, making searching and retrieving relevant content easier. Object classification is important for medical imaging, where it can be used to detect and diagnose diseases and abnormalities. For example, object classification can be used to identify cancerous cells within a medical image, enabling early diagnosis and treatment. Overall, object classification is an important task in computer vision, which enables machines to understand and interpret the visual world around them, making it a crucial technology in a wide range of applications. Caltech 101 Dataset Caltech 101 is a very popular dataset for object recognition in computer vision. It contains images from 101 object categories like “helicopter”, “elephant”, and “chair”, etc, and background categories that contain the images not from the 101 object categories. There are about 40 to 400 images for each object category, while most classes have about 50 images. Images in the Caltech101 dataset Object recognition algorithms can be divided into two groups: recognition of individual objects, and categories. The training of a machine learning model for individual object recognition is easier. But to build a lightweight, light-invariant, and viewpoint variant model, you need a diverse dataset. Categories are more general, require more complex representations, and are more difficult to learn. The appearance of objects within a given category may be highly variable; therefore the model should be flexible enough to handle this. Many machine learning practitioners or researchers use Caltech 101 dataset to benchmark the state-of-the-art object recognition models. The images in all 101 object categories are captured under varying lighting conditions, backgrounds, and viewpoints, making the dataset a good candidate for training a robust computer vision model. Apart from being used for training object recognition algorithms, Caltech 101 is also used for various other tasks like fine-grained image classification, density estimation, semantic correspondence, unsupervised anomaly detection, and semi-supervised image classification. More examples of images from Caltech101 For example, Caltech 101 was used in the paper AutoAugment:Learning augmentation policies from data. This paper proposes a procedure called AutoAugment to automatically search for improved data augmentation policies. Here, they test the transferable property of the augmentation policies by transferring the policies learned on ImageNet to Caltech 101. About the Dataset Research Paper: Learning generative visual models from few training examples: An incremental Bayesian approach tested on 101 object categories Authors: Fei-Fei Li, Marco Andreetto, Marc ‘Aurelio Ranzato and Pietro Perona Dataset Size: 9146 Categories: 101 Resolution: ~300200 pixels Dataset Size: 1.2 GB License: Creative Common Attribution 4.0 International Release: September 2003 Webpage: Caltech webpage, TensorFlow webpage, Torchvision webpage Advantages of using Caltech 101 There are several advantages of using Caltech 101 over similar object recognition datasets, such as: Uniform size and presentation: Most of the images within each category are uniform in image size and in the relative position of objects of interest. Low level of clutter/occlusion: Object recognition algorithms usually store features unique to the object. With a low level of clutter and occlusion, the features would be unique and transferable as well. High-quality annotations: The dataset comes with high-quality annotations which are collected from real-world scenarios, making it a more realistic dataset. High-quality annotations are crucial for classification tasks as they provide the ground truth labels necessary to train and evaluate machine learning algorithms, ensuring the accuracy and reliability of the results. Disadvantages of the Caltech 101 There are a few trade-offs with the Caltech 101 dataset which include: Uniform dataset: The images in the dataset are very uniform and usually not occluded. Hence, object recognition models solely trained on this dataset might not perform well in real-world applications. Limited object classes: Although the dataset contains 101 object categories, it may not be representative of all possible object categories which can limit the dataset’s applicability to real-world scenarios. For example, medical images, industrial objects like machinery, tools, or equipment, or cultural artifacts like artworks, historical objects, or cultural heritage sites. Aliasing and artifacts due to manipulation: Some images have been rotated and scaled from their original orientation, and suffer from some amount of aliasing. However, analyzing a dataset for a computer vision model requires more detailed information about the dataset. It helps in determining if the dataset is fit for your project. With Encord Active you can easily explore the datasets/labels and its distribution. We get information about the quality of the data and labels. Understanding the data and label distribution, quality, and other related information can help computer vision practitioners determine if the dataset is suitable for their project and avoid potential biases or errors in their models. How to download the Caltech 101 Dataset? Since it’s a popular dataset, there are few dataset loaders available. PyTorch If you want to use Pytorch for downloading the dataset, please follow the documentation. torchvison.datasets.Caltech101() TensorFlow If you are using TensorFlow for building your computer vision model and want to download the dataset, please follow the instructions in the link. To load the dataset as a single Tensor, (img_train, label_train), (img_test, label_test) = tfds.as_numpy(tfds.load('caltech101', split=['train', 'test'], batch_size = -1, as_supervised=True)) And its source code is tfds.datasets.caltech101.Builder You can also find this here. Encord Active We will be downloading the dataset using Encord Active here in this blog. It is an open-source active learning toolkit that helps in visualizing the data, evaluating computer vision models, finding model failure modes, and much more. Run the following commands in your favorite Python environment with the following commands: python3.9 -m venv ea-venv source ea-venv/bin/activate # within venv pip install encord-active Or you can follow through the following command to install Encord Active using GitHub: pip install git+https://github.com/encord-team/encord-active To check if Encord Active has been installed, run: encord-active --help Encord Active has many sandbox datasets like the MNIST, BDD100K, TACO datasets, and much more. The Caltech101 dataset is one of them. These sandbox datasets are commonly used in computer vision applications for building benchmark models. Now that you have Encord Active installed, let’s download the Caltech101 dataset by running the command: encord-active download The script asks you to choose a project, navigate the options ↓ and ↑ select the Caltech-101 train or test dataset, and hit enter. The dataset has been pre-divided into a training set comprising 60% of the data and a testing set comprising 40% of the data for the convenience of analyzing the dataset. Easy! Now, you got your data. In order to visualize the data in the browser, run the command: cd /path/to/downloaded/project encord-active visualize The image below shows the webpage that opens in your browser showing the data and its properties. Let’s analyze the properties we can visualize here. Visualize the data in your browser (data = Caltech-101 training data-60% of Caltech-101 dataset) Data Quality of the Caltech 101 Dataset We navigate to the Data Quality → Summary page to assess data quality. The summary page contains information like the total number of images, image size distribution, etc. It also gives an overview of how many issues Encord Active has detected on the dataset and tells you which metric to focus on. The summary tab of Data Quality The Data Quality → Explorer page contains detailed information about different metrics and the data distribution with each metric. A few of the metrics are discussed below: 2D Embeddings In machine learning, a 2D embedding for an image is a technique to transform high-dimensional image data into a 2D space while preserving the most important features and characteristics of the image. The 2D embedding plot here is a scatter plot with each point representing a data point in the dataset. The position of each point on the plot reflects the relative similarity or dissimilarity of the data points with respect to each other. For example, select the box or the Lasso Select in the upper right corner of the plot. Once you select a region, you can visualize the images only in the selected region. 2D embedding plot in Encord Active using the Caltech101 dataset The use of a 2D embedding plot is to provide an intuitive way of visualizing complex high-dimensional data. It enables the user to observe patterns and relationships that may be difficult to discern in the original high-dimensional space. By projecting the data into two dimensions, the user can see clusters of similar data points, outliers, and other patterns that may be useful for data analysis. The 2D embedding plot can also be used as a tool for exploratory data analysis, as it allows the user to interactively explore the data and identify interesting subsets of data points. Additionally, the 2D embedding plot can be used as a pre-processing step for machine learning tasks such as classification or clustering, as it can provide a compact representation of the data that can be easily fed into machine learning algorithms. Area The area metric is calculated as the product of image width and image height. Here, the plot shows a wide range of image areas, which indicates that the dataset has diverse image sources. It may need pre-processing to normalize or standardize the image values to make them more comparable across different images. After 100,000 pixels, there are quite a few images. These images are very large compared to the rest of the dataset. The plot also reveals that after 100,000 pixels, there are few data points. These outliers need to be removed or pre-processed before using them for training. An example of images of people's faces in the dataset, using Encord Active to tag them to assess data quality Aspect Ratios Aspect ratio is calculated as the ratio of image width to image height. Here, the data distribution shows that the aspect ratio varies from 0.27 to 3.88. This indicates that the dataset is very diverse. Aspect ratios The distribution of images with an aspect ratio from 1.34 to 1.98 has the largest density. The rest are the outliers that need to be processed or removed. Normalizing the aspect ratios ensures that all images have the same size and shape. This helps in creating a consistent representation of the data which is easier to process and work with. When the aspect ratios are not normalized, the model has to adjust to the varying aspect ratios of the images in the dataset, leading to longer training times. Normalizing the aspect ratios ensures that the model learns from a consistent set of images, leading to faster training times. Image Singularity The image singularity metric gives each image a score that shows each image’s uniqueness in the dataset. A score of zero indicates that the image is a duplicate of another image in the dataset, while a score close to one indicates that the image is more unique, i.e., there are no similar images to that. This metric can be useful in identifying duplicate and near-duplicate images in a dataset. Near-duplicate images are images that are not exactly the same but contain the same object which has been shifted/rotated/blurred. Overall, it helps in ensuring that each object is represented from different viewpoints. Image singularity is important for small datasets like Caltech101 because, in such datasets, each image carries more weight in terms of the information it provides for training the machine learning model so duplicate images may create a bias. When the dataset is small, there are fewer images available for the model to learn from, and it is important to ensure that each image is unique and provides valuable information for the model. Also, small datasets are more prone to overfitting, which occurs when the model learns to memorize the training data rather than generalize to new data. This can happen if there are too many duplicate or highly similar images in the dataset, as the model may learn to rely on these images rather than learning generalizable features. By using the image singularity metric to identify and remove duplicate or highly similar images, we can ensure that the small dataset is diverse and representative of the objects or scenes we want the model to recognize. This can help to prevent overfitting and improve the generalizability of the model to new data. In order to find the exact duplicates, select the image singularity filter and set the score to 0. We observe that the Caltech101 dataset contains 46 exact duplicates. Image singularity metric showing the exact-duplicate images. Setting the score from 0-0.1, we get the exact duplicates and the near-duplicates. The near-duplicates as also visualized side-by-side so that it is easier to filter them out. Depending on the size of the dataset, it is important to select different thresholds to filter out the near duplicates. For visualization, we have selected a score from 0-0.1 for visualizing near-duplicate images. Selecting different thresholds to filter out the near duplicates The range consists of 3281 images, which accounts for nearly 60% of the training dataset. It's crucial to have these annotations verified by the annotator or machine learning experts to determine whether or not they should be retained in the dataset. Blur Blurring an image refers to intentionally or unintentionally reducing the sharpness or clarity of the image, typically by averaging or smoothing nearby pixel values. It is often added for noise reduction or privacy protection. However, blurred images have negative effects on the performance of object recognition models trained on such images. This is because blur removes or obscures important visual features of objects, making it more difficult for the model to recognize them. For example, blurring can remove edges, texture, and other fine-grained details that are important for distinguishing one object from another. Hence for object recognition models, blur is an important data quality metric. This is because blurring can reduce the image's quality and usefulness for training the model. Assessing Blur for data distribution This data distribution shows blurred images. The blurriness here is computed by applying a Laplacian filter to each image and computing the variance of the output. The distribution above shows that from -1400 to -600 there are few outliers. By detecting and removing these blurred images from the dataset, we can improve the overall quality of the data used to train the model, which can lead to better model performance and generalization. Example of blurred images. Label Quality of the Caltech 101 Dataset To assess label quality, we navigate to the Label Quality→Summary tab and check out the overall information about the label quality of the dataset. Information such as object annotations, classification annotations, and the metrics to find the issues in the labels can be found here. The summary page of label quality. The Explorer page has information about the labeled dataset on the metric level. The dataset can be analyzed based on each metric. The metrics which showed as a red flag on the summary page would be a good starting point for the label quality analysis. Navigating to Label Quality→Explorer, gets you to the explorer page. Image-level Annotation Quality The image-level annotation quality metric compares the image classifications against similar objects. This is a ratio where the value 1 shows that the annotation is correct whereas the value between 0-1 indicates a discrepancy in the annotation and the image classification. Using the data distribution plot to assess image-level annotation quality The data distribution plot clearly shows that there are outliers whose image level annotation quality is questionable. Setting the filter score between 0-0.01 we get 92 images that have label errors. This is a significant level of label errors. These errors occur due to a variety of reasons such as human error, inconsistencies in labeling criteria, etc. Label errors can affect the quality and accuracy of computer vision models that use the dataset. Incorrect labels can cause the model to learn inaccurate patterns and make inaccurate predictions. With a small dataset like Caltech101, it is important to fix these label errors. This shows the class-level distribution of the label errors. The class butterfly and yin-gang have the most label errors. In the above image, we can see how there is a discrepancy between the annotation and what similar objects are tagged in the class butterfly. Having an annotator review these annotations, will improve the label quality of the dataset for building a robust object recognition model. Object Class Distribution The distribution of classes plot below so shows that classes like airplanes, faces, watch, and barrels are over-represented in the Caltech101 dataset. The classes below the median are undersampled. Hence, this dataset is imbalanced. Class imbalance can cause problems in any computer vision model because they tend to be biased towards the majority class, resulting in poor performance for the minority class. The model may have high accuracy overall, but it may miss important instances of the minority class, leading to false negatives. If you want to know how to balance your dataset, please read the blog 9 Ways to balance your computer vision dataset. Balancing your computer vision dataset 2D Embeddings The 2D embedding plot in label quality shows the data points of each image and each color represents the class the object belongs. This helps in finding out the outliers by spotting the unexpected relationships or possible areas of model bias for object labels. This plot also shows the separability of the dataset. A separable dataset is useful for object recognition because it allows for the use of simpler and more efficient computer vision models that can achieve high accuracy with relatively few parameters. 2D embedding plot in label quality Here, we can see, the different classes of objects are well-defined and can be easily distinguished from each other using a simple decision boundary. Hence, the Caltech 101 dataset is separable. A separable dataset is a useful starting point for object recognition, as it allows us to quickly develop and evaluate simple machine learning models before exploring more complex models if needed. It also helps us better understand the data and the features that distinguish the different classes of objects, which can be useful for developing more sophisticated models in the future. Model Quality Analysis We have trained a benchmark model on the training dataset of Caltech101 and will be evaluating the model's performance on the testing dataset. We need to import the predictions to Encord Active to evaluate the model. To find out how to import your predictions into Encord Active, click here. After training the benchmark model, it is natural to be eager to assess its performance. By importing your predictions into Encord Active, the platform will automatically compare your ground truth labels with the predictions and provide you with useful insights about the model’s performance. Some of the information you can obtain includes: Class-specific performance results Precision-Recall curves for each class, as well as class-specific AP/AR results Identification of the 25+ metrics that have the greatest impact on the model’s performance Detection of true positive and false positive predictions, as well as false negative ground truth objects The quality analysis of the model here is done on the test data, which is the 40% of the Caltech101 dataset not used in training. Assessing Model Performance Using Caltech 101 The model accuracy comes to 83% on the test dataset. The mean precision comes to 0.75 and the recall of 0.71. This indicates that the object recognition model is performing fairly well, but there is still room for improvement. Precision refers to the proportion of true positives out of all the predicted positives, while recall refers to the proportion of true positives out of all the actual positives. A precision of 0.75 means that out of all the objects the model predicted as positive, 75% were actually correct. A recall of 0.71 means that out of all the actual positive objects, the model correctly identified 71% of them. While an accuracy of 83% may seem good, it’s important to consider the precision and recall values as well. Depending on the context and task requirements, precision and recall may be more important metrics to focus on than overall accuracy. Assessing Model Performance Using Caltech 101 Performance metrics Our initial aim is to examine which quality metrics have an impact on the performance of the model. If a metric holds significant importance, it suggests that any changes in that metric would considerably influence the model’s performance. Here we see that image singularity, area, Image-level annotation and aspect ratio are the important metrics. These metrics affect positively or negatively on the model. For example: Image Singularity Image singularity negatively affects the benchmark model as more images are more unique. Similarly, the model learns object classes with similar images (not exact duplicates). Hence it is harder for the model to learn those patterns. Area Image area positively affects the benchmark model. High area values mean that images in the dataset have high resolution. High-resolution images provide more information for the classification model to learn. On the other hand, if dealing with limited computational resources, these high-resolution images can affect the benchmark model negatively. High-resolution images require large amounts of memory and processing power making them computationally expensive. Image-level Annotation This metric is useful to filter out the images which are hard for the model to learn. A low score represents hard images whereas a score close to 1 represents the high-quality annotated images that are easy for the model to learn. The high-quality image-level annotations also have no label errors. Precision-Recall Precision and recall are two common metrics used to evaluate the performance of the computer vision model. Precision measures the proportion of true positives out of all the predicted positives. Recall, on the other hand, measures the proportion of true positives out of all the actual positives. Precision and recall are often used together to evaluate the performance of a model. In some cases, a high precision score is more important than recall (e.g., in medical diagnoses where a false positive can be dangerous), while in other cases a high recall score is more important than precision (e.g., in spam detection where missing an important message is worse than having some false positives). It's worth noting that precision and recall are trade-offs; as one increases, the other may decrease. For example, increasing the threshold for positive predictions may increase precision but decrease recall, while decreasing the threshold may increase recall but decrease precision. It's important to consider both metrics together and choose a threshold that balances precision and recall based on the specific needs of the problem being solved. We can refer to the average F1 score on the model performance page to consider both metrics. The F1 score is a measure of the model’s precision and recall. The f1 score is computed for each class in the dataset and averaged across all classes. This provides an insight into the performance of the model across all classes. The precision-recall plot gives the overview of the precision and recall of all classes of objects in our dataset. We can see some of the classes like “Garfield”, and “binocular”, and others, have huge differences, and hence the threshold need to be balanced for a high-performing model. Precision-recall plot Confusion matrix A confusion matrix is a table that is often used to evaluate the performance of a machine learning model on a classification task. It summarizes the predicted labels and the actual labels for a set of test data, allowing us to visualize how well the model is performing. The confusion matrix of the Caltech101 dataset The confusion matrix of the Caltech101 dataset shows the object classes which are often confused. For example, the image below shows that the class Snoopy and Garfield are often confused with each other. Object class snoopy is confused with Garfield Performance By Metric In the performance by metric tab, as the name suggests we can find the true positive rate of different metrics of the predictions. It indicates the proportion of actual positive cases that are correctly identified as positive by the model. We want the true positive rate to be high in all the important metrics (found in the model performance). Earlier, we saw that area, image singularity, etc, are some of the important metrics. The plot below shows the predictions' true positive rate with image singularity as a metric. An example of an average true positive rate The average true positive rate is 0.8 which is a good metric and indicates that the baseline model trained is robust. Misclassifications Going to the Model Quality→Explorer tab, we find the filter to visualize the objects which have been wrongly predicted. We can also find out the misclassifications in each class. Conclusion In this blog, we explored the topic of object classification with a focus on the Caltech 101 dataset. We began by discussing the importance of object classification in computer vision and its various applications. We then introduced the Caltech 101 dataset. We also discussed the importance of data quality in object recognition and evaluated the data quality of the Caltech 101 dataset using the Encord Active tool. We looked at various aspects of data quality, including aspect ratios, image area, blurred images, and image singularity. Furthermore, we evaluated the label quality of the dataset using 2D embedding and image annotation quality. Next, we trained a benchmark object classification model using the Caltech 101 dataset and analyzed its performance on Encord Active. We also evaluated the quality metrics of the model and identified the misclassified objects in each class. Ready to improve the performance and scale your object classification models? Sign-up for an Encord Free Trial: The Active Learning Platform for Computer Vision, used by the world’s leading computer vision teams. AI-assisted labeling, model training & diagnostics, find & fix dataset errors and biases, all in one collaborative active learning platform, to get to production AI faster. Try Encord for Free Today. Want to stay updated? Follow us on Twitter and LinkedIn for more content on computer vision, training data, and active learning. Join the Slack community to chat and connect. Further Steps To further improve the performance of object classification models, there are several possible next steps that can be taken. Firstly, we can explore more sophisticated models that are better suited for the specific characteristics of the Caltech 101 dataset. Additionally, we can try incorporating other datasets or even synthetic data to improve the model's performance. Another possible direction is to investigate the impact of various hyperparameters, such as learning rate, batch size, and regularization, on the model's performance. We can also experiment with different optimization techniques, such as stochastic gradient descent, Adam, or RMSprop, to see how they affect the model's performance. Finally, we can explore the use of more advanced evaluation techniques, such as cross-validation or ROC curves, to better understand the model's performance and identify areas for improvement. By pursuing these further steps, we can continue improving the accuracy and robustness of object classification models, which will significantly impact various fields such as medical imaging, autonomous vehicles, and security systems.
May 05 2023
7 M


Grounding-DINO + Segment Anything Model (SAM) vs Mask-RCNN: A comparison
Are you looking to improve your object segmentation pipeline with cutting-edge techniques? Look no further! In this tutorial, we will explore zero-shot object segmentation using Grounding-DINO and Segment Anything Model (SAM) and compare its performance to a standard Mask-RCNN model. We will delve into what Grounding-DINO and SAM are and how they work together to achieve great segmentation results. Plus, stay tuned for a bonus on DINO-v2, a groundbreaking self-supervised computer vision model that excels in various tasks, including segmentation. What is Zero-Shot Object Segmentation? Zero-shot object segmentation offers numerous benefits in computer vision applications. It enables models to identify and segment objects within images, even if they have never encountered examples of these objects during training. This capability is particularly valuable in real-world scenarios where the variety of objects is vast, and it is impractical to collect labeled data for every possible object class. By leveraging zero-shot object segmentation, researchers and developers can create more efficient and versatile models that can adapt to new, unseen objects without the need for retraining or obtaining additional labeled data. Furthermore, zero-shot approaches can significantly reduce the time and resources required for data annotation, which is often a major bottleneck in developing effective computer vision systems. In this tutorial, we will show you how you can implement a zero-shot object segmentation pipeline using Grounding-DINO and Segment Anything Model (SAM), a SOTA visual foundation model from Meta. In the end, we will compare its segmentation performance to a standard Mask-RCNN model. First, let’s investigate separately what these foundational models are about. What is Grounding DINO? In the paper "Grounding DINO: Marrying DINO with Grounded Pre-Training for Open-Set Object Detection" the authors propose a method for improving open-set object detection. So, what is this open-set object detection? Open-set object detection is a subtask of object detection in computer vision, where the goal is to identify and localize objects within images. However, unlike traditional object detection, open-set object detection recognizes that the model may encounter objects from classes it has not seen during training. In other words, it acknowledges that there might be "unknown" or "unseen" object classes present in real-world scenarios. The challenge in open-set object detection is to develop models that can not only detect known objects (those seen during training) but also differentiate between known and unknown objects and potentially detect and localize the unknown objects as well. This is particularly important in real-world applications where the variety of object classes is immense, and it is infeasible to collect labeled training data for every possible object type. To address this challenge, researchers often employ various techniques, such as zero-shot learning, few-shot learning, or self-supervised learning, to build models capable of adapting to novel object classes without requiring exhaustive labeled data. So, what is Grounding-DINO? In the Grounding-DINO paper, the authors combine DINO, a self-supervised learning algorithm, with grounded pre-training, which leverages both visual and textual information. This hybrid approach enhances the model's ability to detect and recognize previously unseen objects in real-world scenarios. By integrating these techniques, the authors demonstrate improved performance on open-set object detection tasks compared to existing methods. Basically, Grounding-DINO accepts a pair of images and text as input and outputs 900 object boxes along with their objectness confidence. Each box has similarity scores for each word in the input text. At this point, there are two selection processes: Algorithm chooses the boxes that are above the box_threshold. For each box, the model extracts the words whose similarity scores are higher than the defined text_threshold. Source So, with Grounding-DINO we can get the bounding boxes; however, this only solves half of the puzzle. We also want to get the objects segmented, so we will employ another foundation model called the Segment Anything Model (SAM) to use the bounding box information to segment the objects. What is Segment Anything Model (SAM)? Last week Meta released the Segment Anything Model (SAM), a state-of-the-art image segmentation model that will change the field of computer vision. Source SAM is based on foundation models. It focuses on promptable segmentation tasks, using prompt engineering to adapt to diverse downstream segmentation problems. SAM’s design hinges on three main components: The promptable segmentation task to enable zero-shot generalization. The model architecture. The dataset that powers the task and model. Source Learn about all the details of SAM in the full explainer. Merging Grounding DINO and SAM Now we know that given a text prompt and an image, Grounding-DINO can return the most relevant bounding boxes for the given prompt. We also know that given a bounding box and an image, SAM can return the segmented mask inside the bounding box. Now we will stack these two pieces together and given an image and text prompt (which will include our classes) we will get the segmentation results! Baseline Results In Encord Active, we already have predictions for some well-known datasets (COCO, Berkeley Deep Drive, Caltech101, Covid-19 etc.). So for the baseline result, we already know the result in advance. These model performances were obtained by training a Mask-RCNN model on these datasets and inference on the test sets. Then we imported model predictions into Encord-Active to visualize the model performance. In this post, we will oenly cover two datasets: EA-quickstart (200-image subset of COCO) and Berkely DeepDrive (BDD): Exploring quickstart project in Encord Active Exploring BDD project in Encord Active Baseline (inference using trained Mask-RCNN) The top 5 best performing classes ranked according to the Average-Recall (quickstart) The top 5 best performing classes ranked according to the Average-Recall (BDD) Grounding DINO + SAM result We first convert Encord ontology to a text prompt by getting the name of the classes and concatenating them with a period. So, our text prompt for the Grounding-DINO will follow the following pattern: “Class-1 . Class-2 . Class-3 . … . Class-N” When the Grounding-DINO is prompted with the above text, it assigns the given classes into a bounding box if they are above a certain threshold. Then we feed the image and predicted bounding box to SAM to get the segmentation result. Once we do this for all images in the dataset and get the prediction results, we import these predictions into Encord-Active to visualize the model performance. Here are the performance results for the Grounding-DINO+SAM. Grounding DINO + SAM The top 5 best performing classes ranked according to the Average-Recall (EA-quickstart) The top 5 best-performing classes ranked according to the Average-Recall (BDD) Discussion Although Grounding DINO + SAM is behind the Mask RCNN in terms of performance, remember that it is not trained on this dataset at all. So, its zero-shot capabilities are very strong in that sense. Moreover, we have not tuned any of its parameters, so there is probably room for improvement. Now, let’s investigate the performance of Grounding-DINO+SAM in Encord Active and get insights on prediction results. First, let’s check what are the most important metrics for the model performance of BDD: Encord Active demonstrates that the most important metrics for the model performance are related to the predicted bounding box size. As the graph on the right-hand side shows, the size has a positive correlation with the performance. Let’s investigate this metric more by examining performance by the Object Area - Relative plot. To do that using Encord Active, go to the Performance by Metric tab under the Model Quality and choose Object Area - Relative (P) metric under the Filter tab. As the above graph demonstrates, there are certainly some problems with the small objects. The upper plot shows the precision (TP/TP+FP) with respect to the predicted object size. So when the predictions are small, the ratio of false positives to true positives is higher which leads to low precision. In other words, the model must generate many small bounding boxes, which is wrong. The conclusion we need to draw from this graph is that we need to check our small predictions and investigate the patterns among them. The lower plot shows the False Negative Rate (FN\FN+TP) with respect to the object size. It is clear that model cannot detect small objects. So we need to review the small objects and try to understand what could be the possible reason. To review the small objects, go to the Explorer page under the Model Quality tab and filter the False Positive and False Negative samples according to the Object Area - Relative (P) metric. An example of a very small segmented region, which is a false positive An example of a (very problematic) false negative As seen from the examples above, Encord Active can clearly outline the issues in the Grounding-DINO+SAM method. As a next step, our zero-shot object segmentation pipeline can be fine-tuned to improve its performance. Possible actions to improve performance based on the above insights are: Very small bounding box predictions obtained from Grounding-DINO can be eliminated by a size threshold. Confidence value for the boxness_threshold can be reduced to obtain more candidate bounding boxes to increase the probability of catching the ground truths. Bonus: DINO-v2 Meta AI introduced DINO-v2, a groundbreaking self-supervised computer vision model, delivering unmatched performance without the need for fine-tuning. This versatile backbone is suitable for various computer vision tasks, excelling in classification, segmentation, image retrieval, and depth estimation. Built upon a vast and diverse dataset of 142 million images, this cutting-edge model overcomes the limitations of traditional image-text pretraining methods. With efficient implementation techniques, DINOv2 delivers twice the speed and uses only a third of the memory compared to its predecessor, enabling seamless scalability and stability. The next blog post will incorporate DINO-v2 into Grounding-SAM for better object detection. Conclusion We have explored the powerful zero-shot object segmentation pipeline using Grounding-DINO and Segment Anything Model (SAM) and compared its performance to a standard Mask-RCNN model. Grounding-DINO leverages grounded pre-training and self-supervised learning to improve open-set object detection, while SAM focuses on promptable segmentation tasks using prompt engineering. Although Grounding DINO + SAM is currently behind Mask-RCNN in terms of performance, its zero-shot capabilities are impressive, and there is potential for improvement with parameter tuning. Additionally, with DINO-v2 just out, it looks promising. We will run that experiment next and post the results here when finished.
Apr 21 2023
5 M


How To Fine-Tune Segment Anything
Computer vision is having its ChatGPT moment with the release of the Segment Anything Model (SAM) by Meta last week. Trained over 11 billion segmentation masks, SAM is a foundation model for predictive AI use cases rather than generative AI. While it has shown an incredible amount of flexibility in its ability to segment over wide-ranging image modalities and problem spaces, it was released without “fine-tuning” functionality. This tutorial will outline some of the key steps to fine-tune SAM using the mask decoder, particularly describing which functions from SAM to use to pre/post-process the data so that it's in good shape for fine-tuning. What is the Segment Anything Model (SAM)? The Segment Anything Model (SAM) is a segmentation model developed by Meta AI. It is considered the first foundational model for Computer Vision. SAM was trained on a huge corpus of data containing millions of images and billions of masks, making it extremely powerful. As its name suggests, SAM is able to produce accurate segmentation masks for a wide variety of images. SAM’s design allows it to take human prompts into account, making it particularly powerful for Human In The Loop annotation. These prompts can be multi-modal: they can be points on the area to be segmented, a bounding box around the object to be segmented, or a text prompt about what should be segmented. The model is structured into 3 components: an image encoder, a prompt encoder, and a mask decoder. Source The image encoder generates an embedding for the image being segmented, whilst the prompt encoder generates an embedding for the prompts. The image encoder is a particularly large component of the model. This is in contrast to the lightweight mask decoder, which predicts segmentation masks based on the embeddings. Meta AI has made the weights and biases of the model trained on the Segment Anything 1 Billion Mask (SA-1B) dataset available as a model checkpoint. Learn more about how Segment Anything works in our explainer blog post Segment Anything Model (SAM) Explained. What is Model Fine-Tuning? Publicly available state-of-the-art models have a custom architecture and are typically supplied with pre-trained model weights. If these architectures were supplied without weights then the models would need to be trained from scratch by the users, who would need to use massive datasets to obtain state-of-the-art performance. Model fine-tuning is the process of taking a pre-trained model (architecture+weights) and showing it data for a particular use case. This will typically be data that the model hasn’t seen before, or that is underrepresented in its original training dataset. The difference between fine-tuning the model and starting from scratch is the starting value of the weights and biases. If we were training from scratch, these would be randomly initialized according to some strategy. In such a starting configuration, the model would ‘know nothing’ of the task at hand and perform poorly. By using pre-existing weights and biases as a starting point we can ‘fine tune’ the weights and biases so that our model works better on our custom dataset. For example, the information learned to recognize cats (edge detection, counting paws) will be useful for recognizing dogs. Why Would I Fine-Tune a Model? The purpose of fine-tuning a model is to obtain higher performance on data that the pre-trained model has not seen before. For example, an image segmentation model trained on a broad corpus of data gathered from phone cameras will have mostly seen images from a horizontal perspective. If we tried to use this model for satellite imagery taken from a vertical perspective, it may not perform as well. If we were trying to segment rooftops, the model may not yield the best results. The pre-training is useful because the model will have learned how to segment objects in general, so we want to take advantage of this starting point to build a model that can accurately segment rooftops. Furthermore, it is likely that our custom dataset would not have millions of examples, so we want to fine-tune instead of training the model from scratch. Fine tuning is desirable so that we can obtain better performance on our specific use case, without having to incur the computational cost of training a model from scratch. How to Fine-Tune Segment Anything Model [With Code] Background & Architecture We gave an overview of the SAM architecture in the introduction section. The image encoder has a complex architecture with many parameters. In order to fine-tune the model, it makes sense for us to focus on the mask decoder which is lightweight and therefore easier, faster, and more memory efficient to fine-tune. In order to fine-tune SAM, we need to extract the underlying pieces of its architecture (image and prompt encoders, mask decoder). We cannot use SamPredictor.predict (link) for two reasons: We want to fine-tune only the mask decoder This function calls SamPredictor.predict_torch which has the @torch.no_grad() decorator (link), which prevents us from computing gradients Thus, we need to examine the SamPredictor.predict function and call the appropriate functions with gradient calculation enabled on the part we want to fine-tune (the mask decoder). Doing this is also a good way to learn more about how SAM works. Creating a Custom Dataset We need three things to fine-tune our model: Images on which to draw segmentations Segmentation ground truth masks Prompts to feed into the model We chose the stamp verification dataset (link) since it has data that SAM may not have seen in its training (i.e., stamps on documents). We can verify that it performs well, but not perfectly, on this dataset by running inference with the pre-trained weights. The ground truth masks are also extremely precise, which will allow us to calculate accurate losses. Finally, this dataset contains bounding boxes around the segmentation masks, which we can use as prompts to SAM. An example image is shown below. These bounding boxes align well with the workflow that a human annotator would go through when looking to generate segmentations. Input Data Preprocessing We need to preprocess the scans from numpy arrays to pytorch tensors. To do this, we can follow what happens inside SamPredictor.set_image (link) and SamPredictor.set_torch_image (link) which preprocesses the image. First, we can use utils.transform.ResizeLongestSide to resize the image, as this is the transformer used inside the predictor (link). We can then convert the image to a pytorch tensor and use the SAM preprocess method (link) to finish preprocessing. Training Setup We download the model checkpoint for the vit_b model and load them in: sam_model = sam_model_registry['vit_b'](checkpoint='sam_vit_b_01ec64.pth') We can set up an Adam optimizer with defaults and specify that the parameters to tune are those of the mask decoder: optimizer = torch.optim.Adam(sam_model.mask_decoder.parameters()) At the same time, we can set up our loss function, for example Mean Squared Error loss_fn = torch.nn.MSELoss() Training Loop In the main training loop, we will be iterating through our data items, generating masks, and comparing them to our ground truth masks so that we can optimize the model parameters based on the loss function. In this example, we used a GPU for training since it is much faster than using a CPU. It is important to use .to(device) on the appropriate tensors to make sure that we don’t have certain tensors on the CPU and others on the GPU. We want to embed images by wrapping the encoder in the torch.no_grad() context manager, since otherwise we will have memory issues, along with the fact that we are not looking to fine-tune the image encoder. with torch.no_grad(): image_embedding = sam_model.image_encoder(input_image) We can also generate the prompt embeddings within the no_grad context manager. We use our bounding box coordinates, converted to pytorch tensors. with torch.no_grad(): sparse_embeddings, dense_embeddings = sam_model.prompt_encoder( points=None, boxes=box_torch, masks=None, ) Finally, we can generate the masks. Note that here we are in single mask generation mode (in contrast to the 3 masks that are normally output). low_res_masks, iou_predictions = sam_model.mask_decoder( image_embeddings=image_embedding, image_pe=sam_model.prompt_encoder.get_dense_pe(), sparse_prompt_embeddings=sparse_embeddings, dense_prompt_embeddings=dense_embeddings, multimask_output=False, ) The final step here is to upscale the masks back to the original image size since they are low resolution. We can use Sam.postprocess_masks to achieve this. We will also want to generate binary masks from the predicted masks so that we can compare these to our ground truths. It is important to use torch functionals in order to not break backpropagation. upscaled_masks = sam_model.postprocess_masks(low_res_masks, input_size, original_image_size).to(device) from torch.nn.functional import threshold, normalize binary_mask = normalize(threshold(upscaled_masks, 0.0, 0)).to(device) Finally, we can calculate the loss and run an optimization step: loss = loss_fn(binary_mask, gt_binary_mask) optimizer.zero_grad() loss.backward() optimizer.step() By repeating this over a number of epochs and batches we can fine-tune the SAM decoder. Saving Checkpoints and Starting a Model from it Once we are done with training and satisfied with the performance uplift, we can save the state dict of the tuned model using: torch.save(model.state_dict(), PATH) We can then load this state dict when we want to perform inference on data that is similar to the data we used to fine-tune the model. You can find the Colab Notebook with all the code you need to fine-tune SAM here. Keep reading if you want a fully working solution out of the box! Fine-Tuning for Downstream Applications While SAM does not currently offer fine-tuning out of the box, we are building a custom fine-tuner integrated with the Encord platform. As shown in this post, we fine-tune the decoder in order to achieve this. This is available as an out-of-the-box one-click procedure in the web app, where the hyperparameters are automatically set. Original vanilla SAM mask: Mask generated by fine-tuned version of the model: We can see that this mask is tighter than the original mask. This was the result of fine-tuning on a small subset of images from the stamp verification dataset, and then running the tuned model on a previously unseen example. With further training and more examples, we could obtain even better results. 🔥 NEW RELEASE: We released TTI-Eval (text-to-image evaluation), an open-source library for evaluating zero-shot classification models like CLIP and domain-specific ones like BioCLIP against your (or HF) datasets to estimate how well the model will perform. Get started with it on GitHub, and do ⭐️ the repo if it's awesome. 🔥 Conclusion That's all, folks! You have now learned how to fine-tune the Segment Anything Model (SAM). If you're looking to fine-tune SAM out of the box, you might also be interested to learn that we have recently released the Segment Anything Model in Encord, allowing you to fine-tune the model without writing any code.
Apr 13 2023
10 M


Exploring the RarePlanes Dataset
RarePlanes is an open-source machine learning dataset that incorporates both real and synthetically generated satellite imagery. The RarePlanes dataset is built using high-resolution data to test the value of synthetic data from an overhead perspective. This dataset showcases the value of synthetic data and how it aids computer vision algorithms in their ability to automatically detect aircraft and their attributes in satellite imagery. Before we discuss the RarePlanes dataset and build the aircraft detection model, let’s have a look at the importance of synthetic data in computer vision. Source Importance of Synthetic data Building a computer vision algorithm requires a large amount of annotated data. However, developing such datasets is often labor-intensive, time-consuming, and costly to create. The alternative approach to manually annotating training data is to either use platforms that automatically annotate the data or to create computer-generated images and annotations. These computer-generated images and annotations are known as synthetic data. Synthetic data has become increasingly important in the field of computer vision for numerous reasons: Data Scarcity: One of the biggest challenges in computer vision is the availability of sufficient training data. Synthetic data can be generated quickly and in large quantities, providing researchers and developers with the data they need to train and test their models. Data Variety: Real-world data can be limited in terms of its variety and diversity, making it difficult to train models that are robust to different scenarios. Synthetic data can be generated to include a wide variety of conditions and scenarios, allowing models to be trained on a more diverse range of data. Data Quality: Real-world data can be noisy and contain errors, which can negatively impact model performance. Synthetic data can be generated with a high level of precision and control, resulting in cleaner and more accurate data. Cost-effectiveness: Collecting real-world data can be time-consuming and expensive, particularly for complex tasks such as object detection or semantic segmentation. Synthetic data can be generated at a fraction of the cost of collecting real-world data, making it an attractive option for researchers and developers. So, we see that synthetic data has become an important tool in computer vision, enabling researchers and developers to train and test models more effectively and efficiently, and helping to overcome some of the challenges associated with real-world data. Pairing synthetic data with real datasets helps to improve the accuracy and diversity of the training data, which in turn can improve the performance and robustness of machine learning models. Additionally, using synthetic data can help to overcome limitations and biases in real-world data, and can be particularly useful in cases where real data is scarce or expensive to collect. One such example is the RarePlanes dataset. It is made up of both synthetic and real-world datasets. Source Let’s analyze the RarePlanes dataset and know more about it! We will use Encord Active to analyze the dataset, the labels, and the model predictions. In the end, you will be able to know how to analyze a dataset and how to build a robust computer vision model. RarePlanes Dataset Source RarePlanes is the largest open-source very-high-resolution dataset from CosmiQ Works and AI.Reverie. It incorporates both real and synthetically generated satellite imagery. A large portion of the dataset consists of 253 Maxar WorldView-3 satellite scenes spanning 112 locations and 2,142 km^2 with 14,700 hand-annotated aircraft. The accompanying synthetic dataset contains 50,000 synthetic images with ~630,000 aircraft annotations. The aircraft classes that both the synthetic and real datasets contain are: aircraft length Wingspan Wing-shape Wing-position Wingspan class Propulsion Number of engines Number of vertical-stabilizers Presence of canards Aircraft role. One of the unique features of the RarePlanes dataset is that it includes images of rare and unusual aircraft that are not commonly found in other aerial datasets, such as military surveillance drones and experimental aircraft. This makes it a valuable resource for researchers and developers working on object detection in aerial imagery, particularly for applications such as border surveillance, disaster response, and military reconnaissance. About the Dataset Research Paper: RarePlanes: Synthetic Data Takes Flight Authors: Jacob Shermeyer, Thomas Hossler, Adam Van Etten, Daniel Hogan, Ryan Lewis, Daeil Kim Dataset Size: 14,707 real and 629,551 synthetic annotations of aircraft Categories: 10 License: CC-4.0-BY-SA license Release: 4 June 2020 Github: Rareplanes Webpage: RarePlanes webpage link, RarePlanes public user guide Downloading the Dataset So, let’s download the dataset using the instruction from the Rareplanes webpage. It mentions that the dataset is available for free download through Amazon Web Services’ Open Data Program. In this, we will download the RarePlanes dataset using Encord Active! Installing Encord Active You can find the installation guide for Encord Active on the documentation page. In order to install Encord, you have to first make sure you have python3.9 installed on your system. Now, follow through the following commands to install Encord Active: $ python3.9 -m venv ea-venv $ # On Linux/MacOS $ source ea-venv/bin/activate $ # On Windows $ ea-venv\Scripts\activate (ea-venv)$ python -m pip install encord-active To check if Encord Active has been installed, run: $ encord-active --help Now, that you have Encord installed, let’s download the dataset by running the command: $ encord-active download The script will ask you to choose a project, navigate the options ↑ and ↓ to select the RarePlanes dataset and hit enter. Easy! Now, you got your data. In order to visualize your data in the browser run the command: cd /path/to/downloaded/project encord-active visualise The image below shows the webpage that opens in your browser showing the data and its properties. Let’s analyze the properties we can visualize. Fig: Visualize the data in your browser Preliminary Analysis of the Dataset The Encord Active platform has features for you to analyze the data quality and the label quality. Let’s analyze the dataset. Understanding Data Quality First, we navigate to the Data Quality →Explorer tab and check out the distribution of samples with respect to different image-level metrics. Fig: Explorer tab of Data quality Area The distribution of area of the images in the dataset is even and constant since a large percentage of the dataset is generated synthetically. Hence, this would not require much attention during the data pre-processing. Aspect Ratio The aspect ratio of the dataset varies from 1 to 1.01 which means there isn’t much variation in the size of the image throughout the dataset. The aspect ratio of the images is computed as the ratio of image width to image height. Since it is very close to 1, it means the images are square in shape. Since the images are constant, it is very likely that all the images in the dataset have been taken from a single source. So, the images don’t need to be resized during the data preparation process. Brightness The brightness of the images is evenly distributed with the median being at 0.3 brightness. In the data distribution plot below, it can be seen that there are a few outliers from 0.66-0.69. These must be investigated to check their quality and then decide if they are needed during data preparation. Even distribution of the dataset ensures that the detection model will learn to recognise these objects in a wide range of brightness levels. This is necessary when dealing with real-world dataset where the brightness of the surrounding is not controlled. Since the distribution is even, the model will be able to detect the airplanes even when it is very sunny or shadowed because of clouds. Understanding Label Quality Understanding the label quality of an annotated dataset is crucial when building a machine learning model. Investigating the label quality of an annotated dataset refers to the accuracy and consistency of these labels. The accuracy of the computer vision model is highly dependent on the label quality. Having a clear understanding of the label quality and identifying issues earlier allows the team to avoid bias and save time and cost in the long run. Let’s have a look at a few of the quality metrics which can be used to understand label quality: Label Quality To analyze label quality with Encord Active, Go to the label Quality→Explorer tab and analyze the object-level metrics here: Class Distribution In total, there are 6812 annotations for 7 classes. It is clear that there is a high class imbalance with 2 classes having only 10 annotations while two of them have more than 2500 annotations.High class imbalance should be resolved because it can lead to biased and inaccurate detection model. The model will learn to overfit to the majority class and will not be able to detect the minority classes. Additionally, high class imbalance can result in reduced model interpretability and transparency, making it difficult to identify and mitigate potential errors or biases. Object Annotation Quality This quality metric assigns a score to each item based on its closest embedding space neighbors. The annotation's quality will be poor if the nearby neighbors have different labels. We note half of the dataset has high-quality annotation while the quality of the rest of the data degrades to 0. This could indicate a number of things, such as annotation mistakes or that many object classes are semantically highly similar to one another, bringing them closer together in the embedding space. Prior to model training, these should be examined, corrected, and cleaned. Object Aspect Ratio The object aspect ratio computes the aspect ratios (width/height) of the objects. In this case, the object's aspect ratio varies greatly from 0 to 9. Even if we eliminate the outliers from 3, there is still great variability. This can cause scale imbalance (box-level scale imbalance) while training. Scale imbalance occurs because a certain range of object size is over or under represented. For example, here the objects with aspect ratio close to 1 (0.5-1.3) are overly represented. So the trained model will have Region of Interest biased towards these over-represented objects. This can be solved by including a feature pyramid network in the architecture. This will help in taking in account the diversity of bounding boxes’ scales. Preparing Data for Model Training The first step for preparing data for model training is selecting the appropriate machine learning model. Based on which machine learning model we choose, the data needs to be pre-processed and clean accordingly. Here we will be using a Mask-RCNN architecture to train an airplane detection model. For this, we need our data and annotations in COCO annotations format. In Encord Active, we can filter and export the data in COCO format. We want to generate COCO annotations from Encord Active so that the attributes are compatible with Encord Active, so when we train our model using Encord Active and then import the predictions back, images can be matched. To download the dataset, follow the steps: Go to Actions→Filter & Export. Do not filter the data. Click on Generate COCO file, when COCO file is generated, click Download to download COCO annotations. Now you have your annotations for your dataset. The next step before training is to split the dataset into train, validation and test dataset. Splitting the dataset ensures that the model can generalize well to new, unseen data and presents overfitting. The train set is used to train the model, the validation set is used to tune hyperparameters, and the test set is used to evaluate the final performance of the model. Now that our data is ready, let’s train our model using Encord Active! Training A Model We will use the instructions provided by Encord Active for end-to-end training and evaluation for Mask-RCNN in Pytorch. Pre-requisites Anaconda: If you don’t have Anaconda installed, please follow the instructions in the Anaconda Documentation. Download the environment.yml and save it in the folder you want to build your project. Installation Create a new conda virtual environment using the following command # inside the project directory conda env create -f environment.yml Verify that the new environment is installed correctly: conda env list You should see the encord-maskrcnn in the environment list. Now activate this with command: conda activate encord-maskrcnn Training Create config.ini by looking at the example_config.ini. For training, only the [DATA], [LOGGING] and [TRAIN] sections should be filled. All set! You can start the training, simply run the command in your conda environment: python train.py You can check the training progress on the wandb platform. Model checkpoints are saved to the local wandb log folder so that they can be used later for inference. There you go! We have trained an airplane detection model using simple steps with Encord Active. You can infer your predictions and check the quality of the model you have built by: Inference Get the wandb ID from the experiment that you want to use for inference. In your config.ini file, fill out the [INFERENCE] section similar to the example_config.ini Run the command to generate the pickle file with Encord Active attributes: python generate_ea_predictions.py Run the command to import the predictions onto Encord Active. If you want to look for more details, please check here. encord-active import predictions /path/to/predictions.pkl -t /path/to/project Now you can see the model performance on the Model Quality tab! Understanding Model Quality With a new trained model, we definitely want to jump into checking its performance! After uploading your predictions into Encord Active, it automatically matches your ground truth labels and predictions and presents valuable information regarding the performance of the model. For example: mAP performance for different IoU thresholds Precision-Recall curve for each class and class-specific AP/AR results Which of the 25+metrics have the highest impact on the model performance True positive and false positive predictions as well as false negative ground truth objects Quality Metrics We can go to Model Quality→Metrics, to get an insight on the quality metrics. We want to check its impact on model performance. The metric importance graph shows the features like Object Area, frame object density and object count are most important metrics for the model performance. High importance for a metric implies that a change in that quantity would strongly affect model performance. Stay tuned for part two of this analysis in the coming weeks… Conclusion Understanding a new dataset can be a daunting task and can end up being time consuming. In this blog, we explored the RarePlanes dataset. Using the Encord Active platform, we analyzed the model and label quality. After a clear understanding of the dataset, we trained a Mask-RCNN model with simple steps. We also inferred and analyzed the model quality and its performance as well. This model can serve as a baseline model. If you want to know how to improve your computer vision model, please read this blog. The steps followed throughout the article for dataset analysis and model training can be adapted for other datasets as well. Want to test your own models? "I want to get started right away" - You can find Encord Active on Github here. "Can you show me an example first?" - Check out this Colab Notebook. "I am new, and want a step-by-step guide" - Try out the getting started tutorial. If you want to support the project you can help us out by giving a Star on GitHub :) Want to stay updated? Follow us on Twitter and Linkedin for more content on computer vision, training data, MLOps, and active learning. Join the Slack community to chat and connect.
Mar 23 2023
5 M


How to Use the Annotator Training Module
TLDR; The purpose of this post is to introduce the Annotator Training Module we use at Encord to help leading AI companies quickly bring their annotator team up to speed and improve the quality of annotations created. We have created the tool to be flexible for all computer vision labeling tasks across various domains including medical imaging, agriculture, autonomous vehicles, and satellite imaging. It can be used for all annotation types - from bounding boxes and polygons to segmentation, polylines, and classification. Correct annotations and labels are key to training high-quality machine learning models. Annotated objects can range from simple bounding boxes to complex segmentations. We may require annotators to capture additional data describing the objects they are annotating. Encord’s powerful ontology editor allows us to define nested attributes to capture as much data as needed. Even for seemingly simple object primitives, such as bounding boxes, there may be nuances in the data which annotators need to account for. These dataset-specific idiosyncrasies can be wide-ranging, such as object occlusion or ambiguities in deciding the class of an object. It's critical to ensure consistency and accuracy in the annotation process. Existing Practices Data operations teams today follow old and outdated practices including having teams view the data using simple tools such as video players and then answer questions before starting annotations. This does not address the true complexity of accurately annotating many datasets at the quality level required for machine learning algorithms. Teaching annotators how to work with data, understand labeling protocols, and learn annotation tools can take weeks or even months. By combining all three into one, and automating the evaluation process, our new module enables a data operations team to scale its efforts across hundreds of annotators in a fraction of the time – allowing for large gains in cost-savings, efficiency, and helping teams focus on educational efforts on the most difficult assets to annotate. To this end, Encord Annotate now comes with a new powerful Annotator Training Module out-of-the-box so that annotators can learn what is expected of them during the annotation process. At a high level, this consists of first adding ground truth annotations to the platform against which annotators will be evaluated. During the training process, annotators are fed unlabelled items from the ground truth dataset, which they must label. A customizable scoring function converts their annotation performance into numerical scores. These scores can be used to evaluate performance and decide when annotators are ready to progress to a live training project. Using the Annotator Training Module Guide contains following steps: Step 1: Upload Data Step 2: Set up Benchmark Project Step 3: Create Ground Truths Labels Step 4: Set up and Assign Training Projects Step 5: Annotator Training Step 6: Evaluation This walkthrough will show you how to use the Annotator Training Module in the Encord Annotate Web app. This entire workflow can also be run programmatically using the SDK. Step 1: Upload Data First, you create a new dataset that will contain the data on which your ground truth labels are drawn. For this walkthrough, we have chosen to annotate images of flowers from an open source online dataset. Step 2: Set up Benchmark Project Next, you create a new standard project from the Projects tab in the Encord Annotate app. You name the dataset and add an optional description (We recommend to tag it as a Training Ground Truth dataset). We then attach the dataset created in Step 1 containing the unlabelled flower images. Now we create an ontology that will be appropriate to the flower labelling use case, we could also attach an existing ontology if we wanted. Here you can see that we are specifying both scene-level classifications and geometrical objects (both bounding boxes and polygons). Within the objects being defined, you are making use of Encord’s flexible ontology editor to define nested classifications. This helps you capture all the data describing the annotated objects in one place. And lastly, you create the project. Step 3: Create Ground Truth Labels Now that you have created your first benchmark project, you need to create ground truth labels. This can be achieved in two ways. The first option is having subject matter experts use Encord to manually annotate data units, as shown here with the bounding boxes drawn around the flowers. The second option is to use the SDK to programmatically upload labels that were generated outside Encord. Now that you have created the ground truth labels, proceed to set up the training projects. Step 4: Set up and Assign Training Projects Let us create a training project using the training tab in the project section. Create your Training project and add an optional description. It is important that you select the same ontology as the benchmark project. This is because the scoring functions will be comparing the trainee annotations to the ground truth annotations. Next, we can set up the scoring. This will assign scores to the annotator submissions. Two key numbers are calculated: Intersection over Union (IoU): IoU is calculated for objects such as bounding boxes or polygons. The IoU is the fraction of overlap between the benchmark and trainee annotations. Comparison: The comparison compares whether two values are the same, for example the flower species. You can then use the numbers to express the relative weights of different components of the annotations. A higher score means that a component will be more important in calculating the overall score for an annotator. You can also think of this as the ‘number of points available’ for getting this part correct. You can see that I have given the flower species a weight of 100, whereas the flower color has a weight of 10 since it is less important to my use case and so if an annotator misses this or gets it wrong, then they will miss out on fewer points. Finally, we assign annotators to the training module. Step 5: Annotator Training Each annotator will now see the labeling tasks assigned to them. Step 6: Evaluation As the creator of the training module, you can see the performance of annotators as they progress through the training. Here you can see that my two trainees are progressing through the training module, having both completed around 20% of the assigned tasks. You can also see their overall score as a percentage. This score is calculated by the scoring function we set up during the project setup. You can dive deeper into individual annotator performance by looking at the submissions tab, which gives you a preview of annotator submissions. For very large projects we can use the CSV export function to get all submissions. We can now dive deeper into annotator submissions, looking at this example where we notice some mistakes our trainee has made. You can see three things: The trainee mislabelled the flower species. The IoU score for the flower is low (143/200), indicating that the bounding box annotation is not precise. The trainee forgot to describe the scene. By clicking ‘View’, we can see the annotations and indeed realize that this is a poor-quality annotation. The ground truth annotation is shown on the left and the trainee image annotation is shown on the right. You can also change the scoring function if you later decide that certain attributes are more important than others by navigating to the settings tab. Once you have modified the scoring function, you need to hit ‘Recalculate Scores’ on the Summary tab to get the new scores. As already mentioned, you can download a CSV to perform further programmatic analysis of the trainee's performance. Best Practices for Using the Module To ensure the success of your training project, it is important to follow some best practices when using Encord's Annotator Training Module: Define the annotation task clearly: It is important to provide a clear and concise description of the annotation task to ensure that annotators understand the requirements. Use reviewed ground truth labels: Providing reviewed ground truth labels ensures that the annotators have a clear understanding of what is required and helps to measure the accuracy of their annotations. Evaluate annotator performance regularly: Evaluating annotator performance regularly ensures that the annotations are of high quality and identifies any areas where additional training may be required. Continuously improve the annotation training task: As you progress, it is important to continuously review and improve the training tasks you have set up to ensure that it is meeting the project requirements. Conclusion Designed to help machine learning and data operation teams streamline their data labeling onboarding efforts by using existing training data to rapidly upskill new annotators, the new Annotator Training Module enables annotators to get up to speed quickly. This rapid onboarding ensures that businesses can derive insights and make better decisions from their data in a timely manner. Want to stay updated? Follow us on Twitter and LinkedIn for more content on computer vision, training data, and active learning. Join the Slack community to chat and connect.
Mar 08 2023
5 M


Step-by-Step Guide: 4 Ways to Debug Computer Vision Models
What is Computer Vision Model Debugging? We get it– Debugging deep learning models can be a complex and challenging task. Whereas software debugging follows a set of predefined rules to find the root of a problem, deep learning models can be very powerful and complicated, which makes it hard to find bugs in them. The more advanced the neural network selected for the model, the more complex the issues it can have, and the more it behaves as a black box. This is especially true for computer vision models, which are known for their ability to learn relevant features from image data. For example, a deep learning model that has been trained with wrongly preprocessed data can still get good results, but it will fail when tested on a new dataset that has been properly preprocessed. There are many ways to address these problems in machine learning algorithms and make them work better. Firstly, it is crucial to identify flaws in the input data and labels using tools like Encord Active and ensure it is properly preprocessed. Doing this kind of data assessment helps to find potential issues such as missing values, incorrect data, outliers, or skewed data distribution. Secondly, it is possible to find the optimal model hyper-parameters by monitoring training progress with tools like Weights & Biases or TensorBoard. Additionally, monitoring training progress can help detect model problems early on. In this post we will cover 4 practical ways to efficiently debug your computer vision models: using Encord Active to debug your computer vision dataset using Jupyter to debug your computer vision model using Weights & Biases to monitor and debug your computer vision model using TensorBoard to track the performance of your computer vision model Before we dive into the tutorial and cover the four ways let’s go over why we need to debug models in the first place. Why do you need to debug computer vision models? Debugging is a necessary step in the development of computer vision models and algorithms. Computer vision models and algorithms are central to a wide range of applications and use cases, such as image classification, object detection, and segmentation. The models require high precision and accuracy, as even small errors can have significant consequences. Thus data scientists and ML engineers must be prudent in their debugging process. For example, in the case of object detection, a false positive or false negative can lead to incorrect decision-making and actions - a false medical diagnosis made by an image classifier or a car accident caused by autopilot. Example of confused computer vision model - source Debugging is especially important because these models are trained using large amounts of data, and even small errors can cause significant inaccuracies. ML models are often not as robust as one would think. Debugging models involves analyzing data, testing the model, and identifying potential problems. This includes finding and fixing bugs, optimizing performance, and enhancing accuracy. It is an iterative process that requires a thorough understanding of neural networks (especially convolutional neural networks (CNN)) and the model, its structure, and the data used for training. It helps to ensure that the models are working correctly and accurately and that they are less susceptible to overfitting. How to debug machine learning models for computer vision? Debugging involves several steps that help identify and resolve issues in models. The following are the steps involved in debugging your computer vision models: data analysis model testing error analysis visualizing predictions performing ablation studies Data analysis The first step in debugging a computer vision model is to examine the data used for training. The data must be of high quality and free of errors. The quality of the data directly affects the accuracy of the model. Analyzing the data involves checking the distribution of data and ensuring that it is balanced and diverse. A balanced dataset ensures that the model is not biased towards a particular class, leading to better accuracy. Another way to improve data quality is by visualizing the model's predictions and comparing them to the ground truth. Visualizing the predictions helps to identify discrepancies and understand the reasons for errors in the model. Check out this GitHub repo for help with visualizing model predictions. A large-scale high-quality dataset is a crucial step for the state-of-the-art performance of convolutional and transformer models. Model testing Model testing involves running trained models on a test dataset and evaluating their performance. This is an essential step in debugging deep learning models, as it helps identify any issues in the model. Testing the model helps to determine its accuracy and loss metrics. Loss and accuracy metrics are key indicators of the performance of a computer vision model. Such metrics help to determine the accuracy of the model and identify any issues that need to be addressed. By examining the loss and accuracy metrics, it is possible to determine whether the model is overfitting or underfitting and to make the necessary adjustments. Error analysis After testing the model, the next step is to perform an error analysis. Error analysis involves examining the results of the model testing to identify any errors or issues that need to be addressed. The objective of error analysis is to determine the root cause of any errors in the model and to find a solution to fix them. Error analysis in Encord Active Perform ablation studies Ablation studies are a powerful tool for debugging computer vision models. This technique involves removing or changing individual components of the model to determine their impact on its performance and benchmarking them against each other. Ablation studies help to identify the most important components of the model and determine the reasons for any errors. Example of tracking ablation studies in YOLOX (Source:https://arxiv.org/pdf/2107.08430.pdf) The next sections will review popular tools for debugging machine learning models. The table below summarizes the debugging method supported by these tools. What’s the best way to debug a computer vision model? The best way to debug a computer vision model will vary depending on the specific model and problem it is being used to solve, but several best practices can be followed to make the process more effective. Start with a clear understanding of the problem and data: Before diving into the debugging process, it's essential to have a good understanding of the problem being solved and the data being used. This will help guide the process and ensure that the proper steps are taken to fix the model. Use a systematic approach A systematic approach, such as data analysis, model testing, error analysis, and ablation studies (outlined above), can help to ensure that all aspects of the model are thoroughly examined and that any issues are identified and addressed. Keep detailed records Keeping a detailed record of the debugging process, including any changes made to the model, can help to understand the causes of any issues and track progress in resolving them. Work with a team Collaborating with a team can provide multiple perspectives and expertise that can be invaluable in identifying and solving problems more efficiently. Utilize visualization tools Visualization tools can help to better understand the model's behavior and make informed decisions about changes that need to be made. By following these best practices, the debugging process for computer vision models can be optimized, resulting in improved accuracy and state-of-the-art performance. Four Ways To Debug Your Computer Vision Models Debugging a computer vision model can be a complex and time-consuming process. Still, it is a critical step in ensuring that your model is accurate, reliable, and performs well. This part will explore four different methods for debugging computer vision models. Whether you prefer to use your favorite Python IDE, Encord Active, Jupyter notebooks, TensorBoard, or Weights & Biases, you will find a solution that best fits your needs and provides the features and functionality you require. Using Encord Active to debug a computer vision model A data-centric debugging approach focuses on examining the data used for training and testing the model to identify issues that may impact its performance. This approach involves: Data cleaning and preprocessing: Ensure the data used for training and testing is clean, complete, and formatted correctly. Data visualization: Use visualization techniques like scatter plots, histograms, and box plots to understand the data distribution and identify any outliers or patterns that may affect model performance. Data distribution analysis: Analyze the data split (training set, validation set, and test set) to ensure it is representative of the overall data distribution and to avoid overfitting or underfitting the model. Feature engineering: Examine the features used for training the model to ensure they are relevant, informative, and not redundant. Model evaluation: Use appropriate metrics to evaluate the model's performance on the training and testing data. By systematically examining the data used for training and testing the model, a data-centric approach can help identify and resolve issues that may significantly impact its performance. Implementing a data-centric pipeline by yourself, however, is a time-consuming approach. Encord Active is a new open-source active learning toolkit designed with a data-centric approach in mind. It detects label errors efficiently, enabling correction with a few simple clicks. Its user-friendly interface and diverse data visualizations make it easy to understand and debug computer vision models. Encord Active groups data debugging into three types: data debugging: selecting the right data to use data labeling, model training, and validation label debugging: reducing label error rates and label inconsistencies data-centric model debugging: evaluating model performance with respect to different subsets within the dataset, find on what classes model does not perform well All these quality metrics are automatically computed across the dataset, after the data, labels, and/or model output predictions are uploaded to the tool. For example: You can easily find labeling errors in your dataset (mislabeled objects, missing labels, inaccurate labels) by providing Encord Active with your dataset and a pretrained model. The visual similarity search function allows users to locate similar images and duplicates and monitor label quality. Outliers can be identified using precomputed Interquartile ranges displayed on the summary page based on frame-level metrics. If you’d like to try out Encord Active today you can check out the Github Repo here. Further reading: Data-centric Case Study: Improving Analysis and Model Training A Practical Guide to Active Learning for Computer Vision Using Jupyter to debug a computer vision model Jupyter is a popular open-source tool used for scientific computing, data analysis, and visualization. It is a web-based interactive computational environment that allows you to create and share documents that contain live code, equations, visualizations, and narrative text. Jupyter notebooks are often used in computer vision research and development to quickly prototype, test, and debug computer vision models. To debug a computer vision model using Jupyter, you first need to install the necessary libraries, such as NumPy, Matplotlib, OpenCV, and TensorFlow. Once these libraries are installed, you can start writing code in Jupyter to load your computer vision model and test it. Jupyter allows you to debug the code of the model by using a feature called "Debugging with IPython". IPython is an enhanced interactive Python shell that provides several tools to make debugging easier. For example, you can use the "pdb" (Python debugger) to step through the code and inspect variables or use the "%debug" magic command to enter an interactive debugger in Jupyter. When debugging a computer vision model, it is essential to check the accuracy of the model by evaluating it on a test dataset. To visualize evaluation results, you can use Matplotlib to plot training loss history and the accuracy of the model or compare the results of the model with the ground truth data. Another aspect of debugging a computer vision model is inspecting the internal state of the model, such as the weights, biases, and activation functions. In Jupyter, you can inspect model internal states by using TensorFlow's TensorBoard. TensorBoard is a tool that provides a visual interface to visualize the internal state of a TensorFlow model. With TensorBoard, you can inspect the weights and biases of the model, visualize the computation graph, and monitor the performance of the model during training. Finally, Jupyter provides a way to share and collaborate on computer vision models. By sharing Jupyter notebooks, you can share your code, visualizations, and results with others. This makes it easier to collaborate with other researchers and engineers on developing and debugging computer vision models. Using Weights & Biases to debug a computer vision model Weights & Biases is an artificial intelligence platform that provides an interactive dashboard to monitor and debug machine learning models. The platform offers a range of features to analyze the performance of deep neural network models and understand how they are making predictions. One of the key features of Weights & Biases is the ability to visualize the training process of a machine learning model. The platform provides interactive visualizations of the model's performance over time, including loss, accuracy, and other metrics. These visualizations help to identify trends and patterns in the model's performance, helping to understand the reasons for poor performance or to make improvements to the model. Another feature of this tool is the ability to analyze the weights and biases of the model. The platform provides detailed information about the parameters of the model, including the distribution of weights, the magnitude of biases, and the correlation between parameters. This information helps to understand how the model is making predictions and to identify any potential issues or areas for improvement. Weights & Biases also provides an interactive interface for comparing different models and tracking experiment results. The platform allows you to compare the performance of different models on a variety of metrics, such as accuracy, precision, and recall. This makes it easier to compare the results of different models and choose the best model. In addition to the visualization and analysis features, Weights & Biases also provides collaboration and sharing features. The platform allows you to share your results with others, making it easier to collaborate with other researchers and engineers. This is especially useful for teams working on large, complex machine-learning projects. With Weight & Biases, you can upload your TensorBoard logs to the cloud and save all your analysis in one location. The metrics tracked by TensorBoard will be logged in native Weights & Biases charts. To use Weights & Biases, you need to integrate it into your machine learning workflow. The platform provides an API that allows you to log information about your model. Once the information has been logged, it is available in the Weights & Biases dashboard, where you can view and analyze the results. Using TensorBoard to debug a computer vision model TensorBoard is a web-based tool that allows you to visualize and analyze the performance of machine learning models. To start using TensorBoard functions you need to perform two steps: log data for TensorBoard and then start TensorBoard. TensorBoard needs data in a specific format to display it. To log data for TensorBoard, you can use the SummaryWriter class in PyTorch or TensorFlow frameworks. This allows you to write scalar, image, histogram, and other types of data to a file that TensorBoard can display. After logging the data, start TensorBoard by running the tensorboard command in the terminal or command prompt. This will launch a web server that you can access in your web browser to view the data. TensorBoard provides many debugging features, such as: view the model's architecture track the model's training history view histograms and distributions of the model's weights compare experiment results TensorBoard allows you to view the model's architecture, which can help you identify potential issues with the model. You can see the model's graph and the connections between its layers. With TensorBoard you can view the model's performance over time, which can help you identify patterns and trends in the model's performance. This can be especially useful if you're training the model for a long time, as it can be difficult to keep track of the model's performance otherwise. TensorBoard can view the histograms and distributions of the model's weights, which can help you identify issues with the model's weights. For example, if the weights are all the same, this could indicate that the model is not learning from the training data. With TensorBoard, you can visually assess the performance of different experimental outcomes by displaying them side-by-side. This feature is especially valuable when you are experimenting with varying model structures or hyperparameter values as it enables you to identify the most optimal configuration. By using TensorBoard to debug your computer vision model, you can get a better understanding of the model's performance and identify any issues with the model. Remember, debugging models can be an iterative process, so it may take several rounds of experimentation and analysis to get the model to perform optimally. What do I do once I’ve debugged my computer vision model? Once a computer vision model has been successfully debugged, and its performance has improved, the next step is to deploy the model for production use. Deployment involves integrating the model into a larger system, such as a mobile app or a web service, and conducting additional testing to ensure that the model functions as intended in a real-world setting. It is crucial to continuously monitor the performance of the deployed model and make updates as needed to maintain its accuracy and performance over time. This can involve adjusting the model's hyperparameters, retraining the model with new data, or fine-tuning the model to address specific issues that may arise. Additionally, it is recommended to keep a record of the debugging process and any changes made to the model, as this information can be valuable for future improvement or debugging efforts. This information can also help other team members understand the reasoning behind changes made to the model, which can be especially important in larger organizations. Finally, it is essential to consider the overall sustainability and scalability of the model. This may involve designing the model and the deployment system to handle increasing amounts of data and planning for future updates and maintenance. In conclusion, once a computer vision model has been debugged, it is crucial to deploy it for production use. Once in production, you need to continuously monitor its performance, keep records of changes and the debugging process, and consider the model's sustainability and scalability. These steps will help ensure that the model continues to perform effectively and remains up-to-date and relevant. Want to get started with debugging your model in Encord Active? "I want to get started right away" - You can find Encord Active on Github here. "Can you show me an example first?" - Check out this Colab Notebook. "I am new, and want a step-by-step guide" - Try out the getting started tutorial. If you want to support the project you can help us out by giving a Star on GitHub ⭐ Want to stay updated? Follow us on Twitter and LinkedIn for more content on computer vision, training data, and active learning. Join the Slack community to chat and connect.
Feb 09 2023
15 M


Exploring the TACO Dataset [Model Training]
Introduction Imagine for a moment you are building an autonomous robot that can collect litter on the ground. As a machine learning engineer, you'll be responsible for giving it the power to detect trash in any environment. It's a challenge, but with the right detection system, you'll be one step closer to a cleaner world and you’ll have built a cool artificial intelligence robot. After downloading an open-source trash dataset you realize that there are multiple challenges for your model and the performance is very poor even though you apply a state-of-the-art model. That was where we left off in the first part of this data-centric AI case study series. In the previous post, we analyzed the TACO dataset and labels and found that there are many issues with the dataset. In this second part of our the data-centric AI case study, we will start debugging our dataset and improving the performance of our model step-by-step. TLDR; Using a quality metric to calculate the Object Annotation Quality of polygon labels in the popular open-source TACO dataset we found label errors on ~5% of images. By fixing the label errors we improved the mAP for a state-of-the-art computer vision model by nearly 50% from the baseline for the class: Clear plastic bottle. Why Data-Centric AI? As machine learning engineers, it’s important to understand the different approaches to building AI models and the pros and cons of each. The data-centric approach emphasizes a static machine learning model and a focus on improving the underlying training data. A data-centric approach suggests a continuous focus on adding high-value training data in an interactive process to improve the overall model accuracy and performance. On the other hand, a model-centric approach is based on a static dataset with a focus on developing and improving machine learning models and algorithms. This is often the approach taught in classrooms and used in cutting-edge research. In industry, however, the data-centric approach is more prevalent and it is what might drive the future of AI development and the maturation of fields such as MLOps and Active Learning. As machine learning engineers and data scientists, it’s important that we consider the specific requirements and constraints of a problem, and choose the approach that best suits the task at hand. In some cases, a combination of both approaches can be used to achieve the best performance. Andrew Ng, whom you all know, is a pioneer in the field of machine learning, and we would go as far as call him the modern father of data-centric AI (at least he’s the most vocal fan). It’s worth studying his work to gain a deeper understanding of these approaches and how to apply them in practice. If you are interested check out DeepLearning.AI's different resources. What did we learn last time? Let’s first recap the challenges discovered in the TACO dataset in our first blog post: Class imbalance: The dataset contains a lot of classes (60) and we discovered a high class imbalance. A few classes had close to 0 labels (Aluminium blister pack 6, Battery 2, Carded blister pack 1). Similar object classes: Many of the object classes are semantically very similar. Small objects: The majority of the objects are very small e.g. cigarettes, cans, pop tabs. Low labeling quality: The label quality of the crowd-sourced dataset is a lot worse than the official dataset; therefore the labels should be reviewed. We know many of you face these common challenges in your projects when improving your models. Let us formulate a problem statement and try to improve our model performance step-by-step. Problem We set out to improve the performance of a Mask RCNN model on the TACO dataset following a data-centric approach. Since the TACO dataset contains 60 classes, we narrow our focus to one class for this tutorial (and to save some computing power). We ended up picking: Clear plastic bottle: Water and soft drinking bottles made of PET. Why? Well, It is well represented in the dataset (626 annotations in 476 images), and we found that it is often confused with other objects such as Other plastic bottles and Drinking cans. Furthermore, it is an interesting and useful use case, that could potentially be valuable in countries with deposit return systems (such as the Danish or Swedish system). For simplicity we will measure the performance on three metrics: mAP, mAR, and our own Object Annotation Quality metric. About the dataset Research Paper: TACO: Trash Annotations in Context for Litter Detection Author: Pedro F Proença, Pedro Simões Dataset Size: Official: 1500 images, 4784 annotations & Unofficial: 3736 images, 8419 annotations. Categories: 60 litter categories License: CC BY 4.0 Release: 17 March 2020 Read more: Github & Webpage Methodology To improve the machine learning model we set out to use various different strategies: (1) re-labeling bad samples, (2) fixing mislabeled classes, (3) labeling new samples, and (4) data augmentation. For this tutorial, we will attempt strategies (1) and (2) and in the next tutorial we will try (3) and (4). After each iteration, we will re-train the model with the same neural network architecture with the improved unofficial dataset to compare the model performance on the fixed official dataset. Before we jump into it, let’s quickly cover the “Object Annotation Quality” metric: What is the “Object Annotation Quality” Metric? The “Object Annotation Quality” metric calculates the deviation of the class of a label among its nearest neighbors in an embedding space to identify which labels potentially contain errors. Technically the metric transforms polygons into bounding boxes and an embedding for each bounding box is extracted. Then, these embeddings are compared with their neighbors. If the neighbors are annotated differently, a low score is given to it. You can find the technical implementation on the GitHub respository of Encord Active. Great, let us begin. 1st Iteration: Fixing label errors Analysis Using the Object Annotation Quality metric, we can see that the Clear plastic bottle class is confused with Other plastic bottle and sometimes even with the Drinking can class. Tip: You can sort samples of an object class using the Label quality → Explore tab and select any quality metric. Simply choose the Object Annotation Quality metric metric and sort samples in descending order. This will show you the correctly labeled samples for that class first. Let us visualize the three types of objects to get a sense of what they really represent: Fig: From left to right: 1) Clear plastic bottle: Water and soft drinking bottles made of PET. 2) Other plastic bottle: Opaque or translucent. Generally made of HDPE. Includes detergent bottles. 3) Drinking can: Aluminum soda can. The similarity between them does not seem obvious: however, since these annotations are crowdsourced, the annotators might have different levels of context for this use case and the description of each class might cause confusion (given the fact that there are 60 labels classes). Let’s dive into the Encord Active app and open the unofficial dataset. We navigate to Label Quality → Explorer tab, choose Object Annotation Quality as the metric and choose Clear plastic bottle as the target class. Sort samples by ascending to see objects with low annotation quality scores. Here are some examples: Fig: From left to right: 1) Completely off annotation. 2) Bad annotation 3) Both bad annotation and wrong class (the class should be Drinking can) 4) Wrong class (the class should be Other plastic bottle) Using Encord Active, we can directly spot these label errors. Tip: If you have imported your project from the Encord Annotate account, you can directly click the Editor button under each image to open it along with its annotations in the Encord Annotate platform, where you can easily fix the annotations. Re-labeling In this first iteration we will fix the labels of all the objects annotated as Clear plastic bottle. By going through the low annotation quality to high annotation quality, we can identify the lowest quality labels first. Following this approach methodologically we fixed 117 labels for 81 images in a little over 1 hour. After data labeling let’s return to model training. Model re-training Let’s re-train our machine learning model on the updated dataset to see if the performance for the Clear plastic bottles changes. Now, fill in the details of your config.ini file in the project and re-train the model (if you did not do this before, please read the first blog here). After the training, we import the predictions into Encord Active as we did in the previous blog post and inspect the performance. We can see that the performance of the Object Annotation Quality is now at 0.416. The performance results compared to the baseline are in the below table. The new model’s detection performance is 7.7% higher than the baseline for the mAP and it is slightly lower (-1.5%) for the mAR. 2nd Iteration: Fixing wrongly labeled objects Off to a good start; however, we want to investigate other ways of improving model performance for the Clear plastic bottle class. Next, we will look at fixing class label mistakes. We will start by looking at the label quality of the Other plastic bottle objects to identify whether some of the objects are mislabeled as Clear plastic bottle. Analysis First we investigate some of the badly annotated Other plastic bottle labels. We see that many labels in fact belong to the class Clear plastic bottle but are labeled as Other plastic bottle. So, let’s re-label the misclassified images of Other plastic bottle, as we did before. Re-labeling 1.5 hours later and now have re-labeled 150 labels in nearly 100 images (98…). Data labeling is time consuming and tedious, but let’s see how powerful it can be as a data-centric approach to improving the model performance. Model re-training Let’s name this dataset Unofficial-v3 and train a new machine learning model. When the training is finished, we import the predictions for the official dataset, open the app and check the performance of the Object Annotation Quality is now at 0.466. What an improvement! By fixing wrongly labeled Other plastic bottle objects, we improved the performance of our Mask-RCNN machine learning model by 40% in the mAP score. If we were to choose a model-centric AI approach and simply tried to fine-tune the model, such a performance increase would have been nearly impossible. Compared to the baseline, we have improved the performance by almost 50%! In this work, we have only focused on improving a single class performance; but similar results could have been achieved if we did the same work for other classes. Conclusion In the 2nd installment of the Data-centric AI case study series, our goal was to improve the performance of our litter detection model for a specific class. To do that, we utilized a simple data-driven workflow using the open source active learning tool, Encord Active. With the tool we: Found and fixed bad labels to optimize our models performance, leading to higher accuracy on Clear plastic bottle class. Found and fixed objects that have been wrongly classified and fixed the labels. At the end of the two iteration cycles, we improved the mAP of the target class by 47% from the baseline. In the last post of the data-centric AI case study series, we will showcase how to improve the class-based model performance by targeting labeling efforts and augmenting current images. Want to test your own models? "I want to get started right away" - You can find Encord Active on Github here. "Can you show me an example first?" - Check out this Colab Notebook. "I am new, and want a step-by-step guide" - Try out the getting started tutorial. If you want to support the project you can help us out by giving a Star on GitHub :) Want to stay updated? Follow us on Twitter and Linkedin for more content on computer vision, training data, MLOps, and active learning. Join the Slack community to chat and connect.
Jan 25 2023
5 M


Exploring the TACO Dataset [Data Analysis]
Introduction Imagine for a moment you are building an autonomous robot that can collect litter on the ground. The robot needs to detect the litter to collect them and you – as a machine learning engineer – should build a litter detection system. This project, like most real-life computer vision problems, is challenging due to the variety of objects and backgrounds. In this technical tutorial, we will show you how Encord Active can help you in this process. We will use Encord Active to analyze the dataset, the labels, and the model predictions. In the end, you will be know how to build better computer vision model with a data-centric approach. TLDR; We set out to analyze the data and label quality of the TACO dataset and prepare it for model training. Whereafter we trained a Mask-RCNN model and analyzed the performance of our model. The dataset required significant preprocessing prior to training. It contains various outliers and the images are very large. Furthermore, when inspecting class distribution we found a high class imbalance. We found that most of the objects are very small. In addition, the annotation quality of the crowd-sourced dataset is a lot worse than the official dataset; therefore, annotations should be reviewed. Our object detection model perform well on larger objects which are distinct from the background and worse on small undefined objects. Lastly, we inspected overall and class-based performance metrics. We learned that object area, frame object density, and object count have the highest impact on performance over others, and thus we should pay attention to those when retraining the model. Okay! Lets go. The Trash Annotations in Context (TACO) Dataset 🌮 For the tutorial we will use the open-source TACO dataset. The dataset repository contains a official dataset with 1500 images and 4784 annotations and an unofficial dataset with 3736 images and 8419 annotations. Both datasets contain various large and small litter objects on different backgrounds such as streets, parks, and beaches. The dataset contains 60 categories. of litter. Example images from the official dataset: About the dataset Research Paper: TACO: Trash Annotations in Context for Litter Detection Author: Pedro F Proença, Pedro Simões Dataset Size: Official: 1500 images, 4784 annotations & Unofficial: 3736 images, 8419 annotations. Categories: 60 litter categories License: CC BY 4.0 Release: 17 March 2020 Read more: Github & Webpage Downloading the Dataset So, let’s download the dataset from the official website by following the instructions. Currently, there are two datasets, namely, TACO-Official and TACO-Unofficial. The annotations of the official dataset are collected, annotated, and reviewed by the creators of the TACO project. The annotations of the unofficial dataset are provided by the community and they are not reviewed. In this project, we will use the official dataset as a validation set and the unofficial dataset as a training set. Installing Encord Active To directly create a conda virtual environment including all packages, check the readme of the project. Importing the TACO Dataset to Encord Active You can import a COCO project to Encord Active with a single line command: encord-active import project --coco -i ./images_folder -a ./annotations.json We will run the above command twice (once for each dataset). The flow might take a while depending on the performance of your machine, so sit back and enjoy some sweet tunes. This command will create a local Encord Active project and pre-compute all your quality metrics. Quality metrics are additional parameterizations added onto your data, labels, and models; they are ways of indexing your data, labels, and models in semantically interesting and relevant ways. In Encord Active, there are different pre-computed metrics that you can use in your projects. You can also write your own custom metrics. Once the project is imported you will have a local Encord Active project and we can start to understand and analyse the dataset. Understanding Data and Label Quality First, let’s analyze the official dataset. To start the Encord Active application, we run the following command for the official dataset: # from the projects root encord-active visualise OR # from anywhere encord-active visualise --target /path/to/project/root Your browser will open a new window with Encord Active. Data Quality Now let’s analyze the dataset. First, we navigate to the Data Quality → Explorer tab and check the distribution of samples with respect to different image-level metrics. Area: The Images in the dataset are fairly large, where the median image size is around 8 megapixels (roughly 4000x2000). So, they need to be processed properly before the training. Otherwise reading them from the disk will create a serious bottleneck in the data loader. In addition, we can see on the plot below that there are a few outliers of very large images and very small images. Those can be excluded from the dataset. Aspect Ratio: Most images have an aspect ratio of around 0.8, which brings to mind that they are mostly taken with mobile phone cameras (in a vertical direction) which may create a potential bias when going to production. Brightness: Most images are taken during the daytime, and there are a few images taken during the evening (when it is a bit darker). So, this will potentially affect the performance of the model when it is run in environments where it is darker. Label Quality Next, we will analyze the label quality. Go to the Label Quality → Explorer tab and analyze the object-level metrics here: Class distribution: In total, there are 5038 annotations for 59 classes. It is clear that there is a high class imbalance with some classes having fewer than 10 annotations, and some more than 500. Frame Object Density: In most of the images, objects only cover a small part of the image, which means annotation sizes are small compared to the image size. Thus it is important we choose a model accordingly (AKA avoid using models that have problems with small objects). Object Annotation Quality: This metric gives a score for each object according to its closest neighbors in the embedding space. If the closest neighbors have a different label, the quality of the annotation will be low. We see that there are many samples with low object quality scores. This may mean several things: for example, different object classes may be semantically very close to each other, which makes them closer in the embedding space, or there might be annotation errors. These should be analyzed, cleaned, and fixed before model training. Another interesting point is that when the average object annotation quality scores are compared between the unofficial and official datasets (mean score under Annotator statistics), there is a huge difference (0.195 vs. 0.336). Average scores show that the unofficial dataset has lower annotation quality, so a review of the annotations should be performed before the training. Distribution of the object annotation quality for the official dataset Distribution of the object annotation quality for the unofficial dataset Object Area - Relative: Most of the objects are very small compared to the image. So, for this problem, images can be tiled or frameworks like SAHI can be used. Takeaways and Insights Based on the preliminary analysis we can draw following conclusions: The images are very large with few outliers, thus we should downsize the images prior to model training and remove the outliers. The aspect ratio of most images show that they are probably taken on phone cameras in a vertical perspective. This could potential bias our inference if the edge devices are different. A underrepresentation of dark images (night time) can have an effect on our litter detection system at night in a production environment. The dataset has a few overrepresented classes (cigarettes, plastic film, unlabeled litter) and many categories with below 20 annotations. The annotation quality is significantly worse in the unofficial dataset compared to the official dataset. Whether this is due to label errors or otherwise needs to be investigated. Next let us start to prepare the data for training :) Preparing Data for Model Training First, let’s filter and export the data and annotations to create COCO annotations. Although the datasets already contain COCO annotations, we want to generate a new COCO file where attributes are compatible with Encord Active so when we import our predictions to Encord Active, images can be matched. Go to Actions → Filter & Export. Do not filter the data. Click Generate COCO file, when COCO file is generated, click Download filtered data to download COCO annotations. We perform this operation for both the unofficial and the official dataset. In every batch, images should be loaded from the disk, however, as we concluded above, they are too large to be loaded efficiently. Therefore, to avoid creating any bottlenecks in our pipeline, we downscale them before starting the training. An example of this can be seen in the project folder utils/downscale_dataset.py. We have scaled all the images to 1024x1024. Loaded images will also be scaled internally by our model before feeding into the model. Training a Model For training, we chose to train Mask-RCNN architecture in the Torchvision package. Further, we used PyTorch to train it and Wandb to log the performance metrics. Create a dataset class We have implemented EncordMaskRCNNDataset class, which can be used with any COCO dataset generated from the Encord Active so it can be used not just for this project but any project generated from the Encord Active. It transforms the input and output into the format that MaskRCNN model wants: class EncordMaskRCNNDataset(torchvision.datasets.CocoDetection): def __init__(self, img_folder, ann_file, transforms=None): super().__init__(img_folder, ann_file) self._transforms = transforms def __getitem__(self, idx): img, target = super().__getitem__(idx) img_metadata = self.coco.loadImgs(self.ids[idx]) image_id = self.ids[idx] img_width, img_height = img.size boxes, labels, area, iscrowd = [], [], [], [] for target_item in target: boxes.append( [ target_item["bbox"][0], target_item["bbox"][1], target_item["bbox"][0] + target_item["bbox"][2], target_item["bbox"][1] + target_item["bbox"][3], ] ) labels.append(target_item["category_id"]) area.append(target_item["bbox"][2] * target_item["bbox"][3]) iscrowd.append(target_item["iscrowd"]) segmentations = [obj["segmentation"] for obj in target] masks = convert_coco_poly_to_mask(segmentations, img_height, img_width) processed_target = {} processed_target["boxes"] = torch.as_tensor(boxes, dtype=torch.float32) processed_target["labels"] = torch.as_tensor(labels, dtype=torch.int64) processed_target["masks"] = masks processed_target["image_id"] = torch.tensor([image_id]) processed_target["area"] = torch.tensor(area) processed_target["iscrowd"] = torch.as_tensor(iscrowd, dtype=torch.int64) if self._transforms is not None: img, processed_target = self._transforms(img, processed_target) return img, processed_target, img_metadata def __len__(self): return len(self.ids) Create data loader After defining the Torchvision dataset we create a dataset for the data loader: dataset = EncordMaskRCNNDataset( img_folder=params.data.train_data_folder, ann_file=params.data.train_ann, transforms=get_transform(train=True), ) data_loader = torch.utils.data.DataLoader( dataset, batch_size=params.train.batch_size, shuffle=True, num_workers=params.train.num_worker, collate_fn=collate_fn, ) Create a training loop The training loop is very straightforward. For each epoch, we train the model on the training set. Once the training is finished for that epoch, we measure the performance on training and validation sets and log the results. To make this training more elegant we have: Used a learning rate scheduler to decrease the learning rate when the performance is saturated. Used Adam optimizer to quickly converge. Only saved the best-performing model checkpoint. Used the TorchMetrics library to calculate mAP. for epoch in range(params.train.max_epoch): print(f"epoch: {epoch}") train_one_epoch(model, device, data_loader, optimizer, log_freq=10) if epoch % params.logging.performance_tracking_interval == 0: train_map = evaluate(model, device, data_loader, train_map_metric) val_map = evaluate(model, device, data_loader_validation, val_map_metric) scheduler.step(val_map["map"]) if params.logging.wandb_enabled: train_map_logs = {f"train/{k}": v.item() for k, v in train_map.items()} val_map_logs = {f"val/{k}": v.item() for k, v in val_map.items()} wandb.log( { "epoch": epoch + 1, "lr": optimizer.param_groups[0]["lr"], **train_map_logs, **val_map_logs, } ) val_map_average = val_map["map"].cpu().item() if val_map_average > best_map * (1 + 0.0001): early_stop_counter = 0 best_map = val_map_average print("overwriting the best model!") if params.logging.wandb_enabled: wandb.run.summary["best map"] = best_map torch.save( model.state_dict(), os.path.join(wandb.run.dir, "best_maskrcnn.ckpt"), ) else: torch.save(model.state_dict(), "weights/best_maskrcnn.ckpt") else: early_stop_counter += 1 if early_stop_counter >= params.train.early_stopping_thresh: print("Early stopping at: " + str(epoch)) break print("Training finished") We have provided the supportive and utility functions and modules inside the project folder. Before diving into the full model training, let’s check if the training pipeline works as expected. To check that, we run the training on a few samples and expect the model to overfit into those samples. This is a common trick to check if the training pipeline works from end to end as expected. We have prepared a configuration file (config.ini) to set the training scripts. Once all the paths and training parameters are set correctly, we can start training: (encord-maskrcnn) > python train.py Model checkpoints are saved to the local wandb log folder so that we can use it later for inference. Here is a sample log result for mAP and mAP@50 for both training and validation sets. Parameters used for training Learning rate = 0.0001 Batch size = 10 Epoch = 30 Num worker = 4 Importing Predictions to Encord Active There are a few ways to import predictions into Encord Active, for a more detailed explanation please check here. In this tutorial we will prepare a pickle file consisting of Encord Active Prediction objects, so they can be understood by the Encord Active. First, we need to locate the wandb folder to get the path of the model checkpoint. Every wandb experiment has a unique ID, which can be checked from the overview tab of the experiment on the wandb platform. Once you learned the wandb experiment ID, local checkpoint should be somewhere like this: /path/to/project/wandb/run-[date_time]_[wandb_id]/files/best_maskrcnn.ckpt Once you set up the inference section of the config.ini file, you can generate Encord Active predictions. Here is the main loop to generate the pickle file: model.eval() with torch.no_grad(): for img, _, img_metadata in tqdm( dataset_validation, desc="Generating Encord Predictions" ): prediction = model([img.to(device)]) scores_filter = prediction[0]["scores"] > confidence_threshold masks = prediction[0]["masks"][scores_filter].detach().cpu().numpy() labels = prediction[0]["labels"][scores_filter].detach().cpu().numpy() scores = prediction[0]["scores"][scores_filter].detach().cpu().numpy() for ma, la, sc in zip(masks, labels, scores): contours, hierarchy = cv2.findContours( (ma[0] > 0.5).astype(np.uint8), cv2.RETR_TREE, cv2.CHAIN_APPROX_NONE ) for contour in contours: contour = contour.reshape(contour.shape[0], 2) / np.array( [[ma.shape[2], ma.shape[1]]] ) prediction = Prediction( data_hash=img_metadata[0]["data_hash"], class_id=encord_ontology["objects"][la.item() - 1][ "featureNodeHash" ], confidence=sc.item(), format=Format.POLYGON, data=contour, ) predictions_to_store.append(prediction) with open( os.path.join(validation_data_folder, f"predictions_{wandb_id}.pkl"), "wb" ) as f: pickle.dump(predictions_to_store, f) Once we have the pickle file, we run the following command to import predictions: encord-active import predictions /path/to/predictions.pkl Lastly, we refresh the Encord Active browser. Understanding Model Quality With a freshly trained model, we’re ready to gather some insights. Encord Active automatically matches your ground-truth labels and predictions and presents valuable information regarding the performance of your model. For example: mAP performance for different IoU thresholds Precision-Recall curve for each class and class-specific AP/AR results Which of the 25+ metrics have the highest impact on the model performance True positive and false positive predictions as well as false negative ground-truth objects First we evaluate the model on a high-level. Model Performance As explained previously we used the unofficial dataset for the training and official dataset for validation. For the entire dataset we achieved a mAP @ 0.5 IOU at 0.041. The mAP is very low. This means that the model is having difficulty detecting litters. We have also trained a model where both training and validation sets are from the official dataset, and the results were around 0.11, which is comparable with the reported results in the literature. This result also shows how difficult our task is. Important Quality Metrics First we want to investigate what quality metrics impact model performance. High importance for a metric implies that a change in that quantity would strongly affect model performance: Hmm... object area, frame object density, and object count are most important metrics for the model performance. We should investigate that. Best performing objects Not surprisingly, among the best performing object are larger and distinct object such as cans and bottles. Worst performing objects Worst performing objects are the ones which do not have a clear definition: other plastic, other cartoon, unlabeled litter. Other model insights Next we, go dive into the model performance by metric and examine performance with respect to different metrics. Here are some insights we got from there: False negative rate and object count (number of labels pr. image) are directly proportional. The model tends to miss ground-truth objects when the sharpness value of the image is low (Image is more blurry). The smaller an object is relative to the image the worse performance. This is especially true for objects whose area are less than 0.01% of the image. True positives Let’s examine a few true positive: The model segments some objects very well. In this tab, we can rank all true positives according to a metric that we want. For example, if we want to visualize correctly segmented objects in small images, we can select the area metric on the top bar. False positives Let’s examine a few false positives: We see some interesting patterns here. The model’s segmentation for the objects are quite good, however, they are regarded as false positives. This may mean two things: 1) the model is confused about the object class or 2) there is a missing annotation. After inspecting the ground truth labels, we found that there are some classes which are confused with each other (e.g., garbage bag vs. single use carrier bag, glass bottle vs. other plastic bottle). Examples from picture below The glass bottle is detected as other plastic bottle. The paper cup has no ground truth annotation: The single use carrier bag is perfectly detected as a garbage bag. If we detect frequently confused objects, we can provide more data for these object classes or we can add specific post-processing steps to our inference pipeline, which will eventually increase our overall performance. These points are all very valuable to know when building our litter detection system since they show us areas we need improvement in our computer vision pipeline. Conclusion With the help of the Encord Active, we now have a better understanding of what we have in our hands and we: Obtained useful information on images such as their area, aspect ratio, brightness levels, which might be useful in building the training pipeline. Inspected class distribution and learned that there is a high class imbalance. Found that most of the objects are very small. In addition, the annotation quality of the crowd-sourced dataset is a lot worse than the official dataset; therefore, annotations should be reviewed. Inspected overall and class-based performance metrics. We learned that object area, frame object density, and object count have the highest impact on performance over others, and thus we should pay attention to those when retraining the model. Visualized true positives and false positive samples and figured out that there is a class mismatch problem. If this is solved, it will significantly reduce the false negatives. Further Steps With the insights we got from Encord Active, we now know what should be prioritized. In the second part of this tutorial, we will utilize the information we obtained here to improve our baseline result with a new and improved dataset. Want to test your own models? "I want to get started right away" - You can find Encord Active on Github here. "Can you show me an example first?" - Check out this Colab Notebook. "I am new, and want a step-by-step guide" - Try out the getting started tutorial. If you want to support the project you can help us out by giving a Star on GitHub :) Want to stay updated? Follow us on Twitter and Linkedin for more content on computer vision, training data, and active learning. Join the Slack community to chat and connect.
Jan 11 2023
5 M


How to Find and Fix Label Errors with Encord Active
Introduction Are you trying to improve your model performance by finding label errors and correcting them? You’re probably spending countless hours manually debugging your data sets to find data and label errors with various scripts in Jupyter Notebooks. Encord Active, a new open-source active learning framework makes it easy to find and fix label errors in your computer vision datasets. With Encord Active, you can quickly and easily identify label errors in your datasets and fix them with just a few clicks. Plus, with a user-friendly UI and a range of different visualizations to slice your data, Encord Active makes it easier than ever to investigate and understand the failure modes in your computer vision models. In this guide, we will show you how to use Encord Active to find and fix label errors in the COCO validation dataset. Before we begin, let us quickly recap the three types of label errors in computer vision. Label errors in computer vision Incorrect labels in your training data can significantly impact the performance of your computer vision models. While it's possible to manually identify label errors in small datasets, it quickly becomes impractical when working with large datasets containing hundreds of thousands or millions of images. It’s basically like finding a needle in a haystack. The three types of labeling errors in computer vision are: Mislabeled objects: A sample that has a wrong object class attached to it. Missing labels: A sample that does not contain a label. Inaccurate labels: A label that is either too tight, too loose, or overlaps with other objects. Below you see examples of the three types of errors on a Bengalese tiger: Tip! If you’d like to read more about label errors, we recommend you check out Data errors in Computer Vision. How to find label errors with a pre-trained model As your computer vision activities mature, you can use a trained model to spot label errors in your data annotation pipelines. You will need to follow a simple 4-step approach: Run a pre-trained model on your newly annotated samples to obtain model predictions. Visualize your model predictions and ground truth labels on top of each other. Sort for high-confidence false positive predictions and compare them with the ground truth labels. Flag missing or wrong labels and send them for re-labeling. Tip! It is important that the computer vision model you use to get predictions has not been trained on the newly annotated samples we are investigating. How to fix label errors with Encord Active Getting started The sandbox dataset used in this example is the COCO validation dataset combined with model predictions from a pre-trained MASK R-CNN RESNET50 FPN V2 model. The sandbox dataset with labels and predictions can be downloaded directly from Encord Active. Tip! The quality of your model can greatly impact the effectiveness of using it to identify label errors. The better your model, the more accurate the predictions will be. So be sure to carefully select and use your model to get the best results. First, we install Encord Active using pip: $ pip install encord-active Hereafter, we download a sandbox dataset: $ encord-active download Loading prebuilt projects ... [?] Choose a project: [open-source][validation]-coco-2017-dataset (1145.2 mb) > [open-source][validation]-coco-2017-dataset (1145.2 mb) [open-source]-covid-19-segmentations (55.6 mb) [open-source][validation]-bdd-dataset (229.8 mb) quickstart (48.2 mb) Downloading sandbox project: 100%|################################################| 1.15G/1.15G [00:22<00:00, 50.0MB/s] Unpacking zip file. May take a bit. ╭───────────────────────────── 🌟 Success 🌟 ─────────────────────────────╮ │ │ │ Successfully downloaded sandbox dataset. To view the data, run: │ │ │ │ cd "C:/path/to/[open-source][validation]-coco-2017-dataset" │ │ encord-active visualise │ │ │ ╰─────────────────────────────────────────────────────────────────────────╯ Lastly, we visualize Encord Active: cd "[open-source][validation]-coco-2017-dataset" $ encord-active visualise In the UI, we navigate to the false positive page. A false positive prediction is when a model incorrectly identifies an object and gives it a wrong class or if the IOU is lower than the determined threshold . For example, if a model is trained to recognize tigers and mistakenly identifies a cat as a tiger, that would be a false positive prediction. Next, we select the metric “Model confidence” and filter for predictions with >75% confidence. Using the UI we can then sort for the highest confidence false positives to find images with possible label errors. In the example below, we can see that the model has predicted four missing labels on the selected image. The objects missing are a backpack, a handbag, and two people. The predictions are marked in purple with a box around them. As all four predictions are correct the label errors can automatically be sent back to the label editor to be corrected immediately. Similarly, we can use the false positive predictions to find mislabeled objects and send them for re-labeling in your label editor. The vehicle below is predicted with 99.4% confidence to be a bus but is currently mislabeled as a truck. Using Encord’s label editor, we can quickly correct the label. To find and fix any remaining incorrect labels in the dataset, we repeated this process until we were satisfied. If you're curious about identifying label errors in your own training data, you can try using Encord Active, the open-source active learning framework. Simply upload your data, labels, and model predictions to get started. Conclusion Finding and fixing label errors is a tedious manual process that can take countless hours. It is often done manually by shifting through one image at a time or writing one-off scripts in Jupyter notebooks. The three different label error types are 1) missing labels, 2) wrong labels, and 3) inaccurate labels. The easiest way to find and fix label errors and missing labels is to use a trained model to spot label errors in your training dataset by running a model. Want to test your own models? "I want to get started right away" - You can find Encord Active on Github here. "Can you show me an example first?" - Check out this Colab Notebook. "I am new, and want a step-by-step guide" - Try out the getting started tutorial. If you want to support the project you can help us out by giving a Star on GitHub :) Want to stay updated? Follow us on Twitter and Linkedin for more content on computer vision, training data, and active learning. Join our Discord channel to chat and connect.
Dec 19 2022
8 M


Software To Help You Turn Your Data Into AI
Forget fragmented workflows, annotation tools, and Notebooks for building AI applications. Encord Data Engine accelerates every step of taking your model into production.